- B2B SaaS
- Live Streaming
- Data Analytics
Kwai Guild Dashboard
A weekly reporting and churn-alert dashboard that took guild managers from flying blind to acting early — built inside Kuaishou's agency platform, Voyager.
- Role
- Product Builder
- Team
- KuaiShou (Kwai)
- Timeline
- 4 weeks · 2024
- Tools
- Figma
Overview
Guild managers ran rosters worth millions on gut feel.
Kuaishou (Kwai) is a leading short-video and livestreaming platform with over 600 million monthly active users. Its livestreaming business runs on guilds — agencies that recruit streamers, coach them, and earn a commission on what their streamers make. Voyager is Kuaishou's internal platform for those agencies and creators.
I designed a weekly reporting and churn-alert dashboard inside Voyager for guild managers on PC. It reorganizes the metrics that matter, surfaces at-risk streamers from revenue trends before they churn, and turns a reactive, gut-feel routine into a proactive one.
Problem
Managers lacked timely insight, so tracking performance or catching churn early was hard. Tools were fragmented and reactive, and action came late.
What I did
Designed a weekly report and churn-alert system for PC. Key metrics were reorganized for clarity; at-risk streamers were surfaced from revenue trends.
Impact
Faster data visibility and response. Managers could address churn risk proactively and make tier and promotion calls with confidence.
Research
Finding where managers were flying blind.
To make the tool scale across guilds — and hold up for overseas operations — I combined qualitative and quantitative methods: interviews and surveys, analysis of behavioral and platform data, and a steady back-channel with the operations team who talk to guild managers every day.
Context
What is a guild?
A guild is a management group that recruits and supports streamers. Day to day, guilds:
- Provide coaching, technical support, and content guidance
- Help streamers grow their audiences and revenue
- Earn a commission on the performance of the streamers they manage
Interviews
What managers told us
I interviewed six guild managers across top, mid, and emerging tiers. Three themes came through clearly.
Flying blind
Managers leaned on intuition and self-reported updates, because timely data simply wasn't there.
No way to compare
There was no like-for-like way to compare streamers within a guild.
A pull toward alerts
Strong, repeated demand for structured alerts and one clear, centralized view.
Guild managers need timely, structured, actionable insight — to monitor performance, catch churn early, scale their operations, and lift the quality of every stream.
From pain points to opportunities
Four pains, turned into four bets.
Mapping what we heard against platform goals turned four recurring pains into four opportunities to design against.
Finding
Timely insight was missing; tooling was fragmented and reactive.
Pain point
Low visibility into performance and a slow response to churn.
Opportunity
Surface key streamer metrics earlier, and make risk alerts something you can act on.
Finding
Managers juggled multiple scattered tools to monitor one guild.
Pain point
High cognitive load and constant workflow friction.
Opportunity
Pull fragmented tools into one centralized, structured dashboard.
Finding
Growth was hard to track; tier standards were unclear.
Pain point
No clear sense of where a guild stood or who to invest in.
Opportunity
Visualize guild-tier progression and make strategic growth legible.
Finding
The homepage and detail pages lacked structure.
Pain point
Information overload and low engagement.
Opportunity
Redesign the information architecture to cut reading load and lead with what matters.
Design strategies
Four places better design changes a manager’s day.
Research pointed to four places where better design could change a manager's day.
Guild overview metrics
Daily, weekly, and monthly trends, visualized clearly so managers spot growth or decline early and act on it.
Tier classification
Transparency and tier-progression cues, so managers can prioritize higher-value streamers and time promotions.
Churn-risk alerts
A predictive alert built on activity drops and income decline, so at-risk streamers get attention before they leave.
Top-performer highlights
Surface outperformers by income and growth, benchmark them against guild averages, and replicate what works.
Solution
Each strategy became a view in the dashboard.
Here is what shipped — four views, each answering a question a manager was already asking.
View 01
Guild data overview
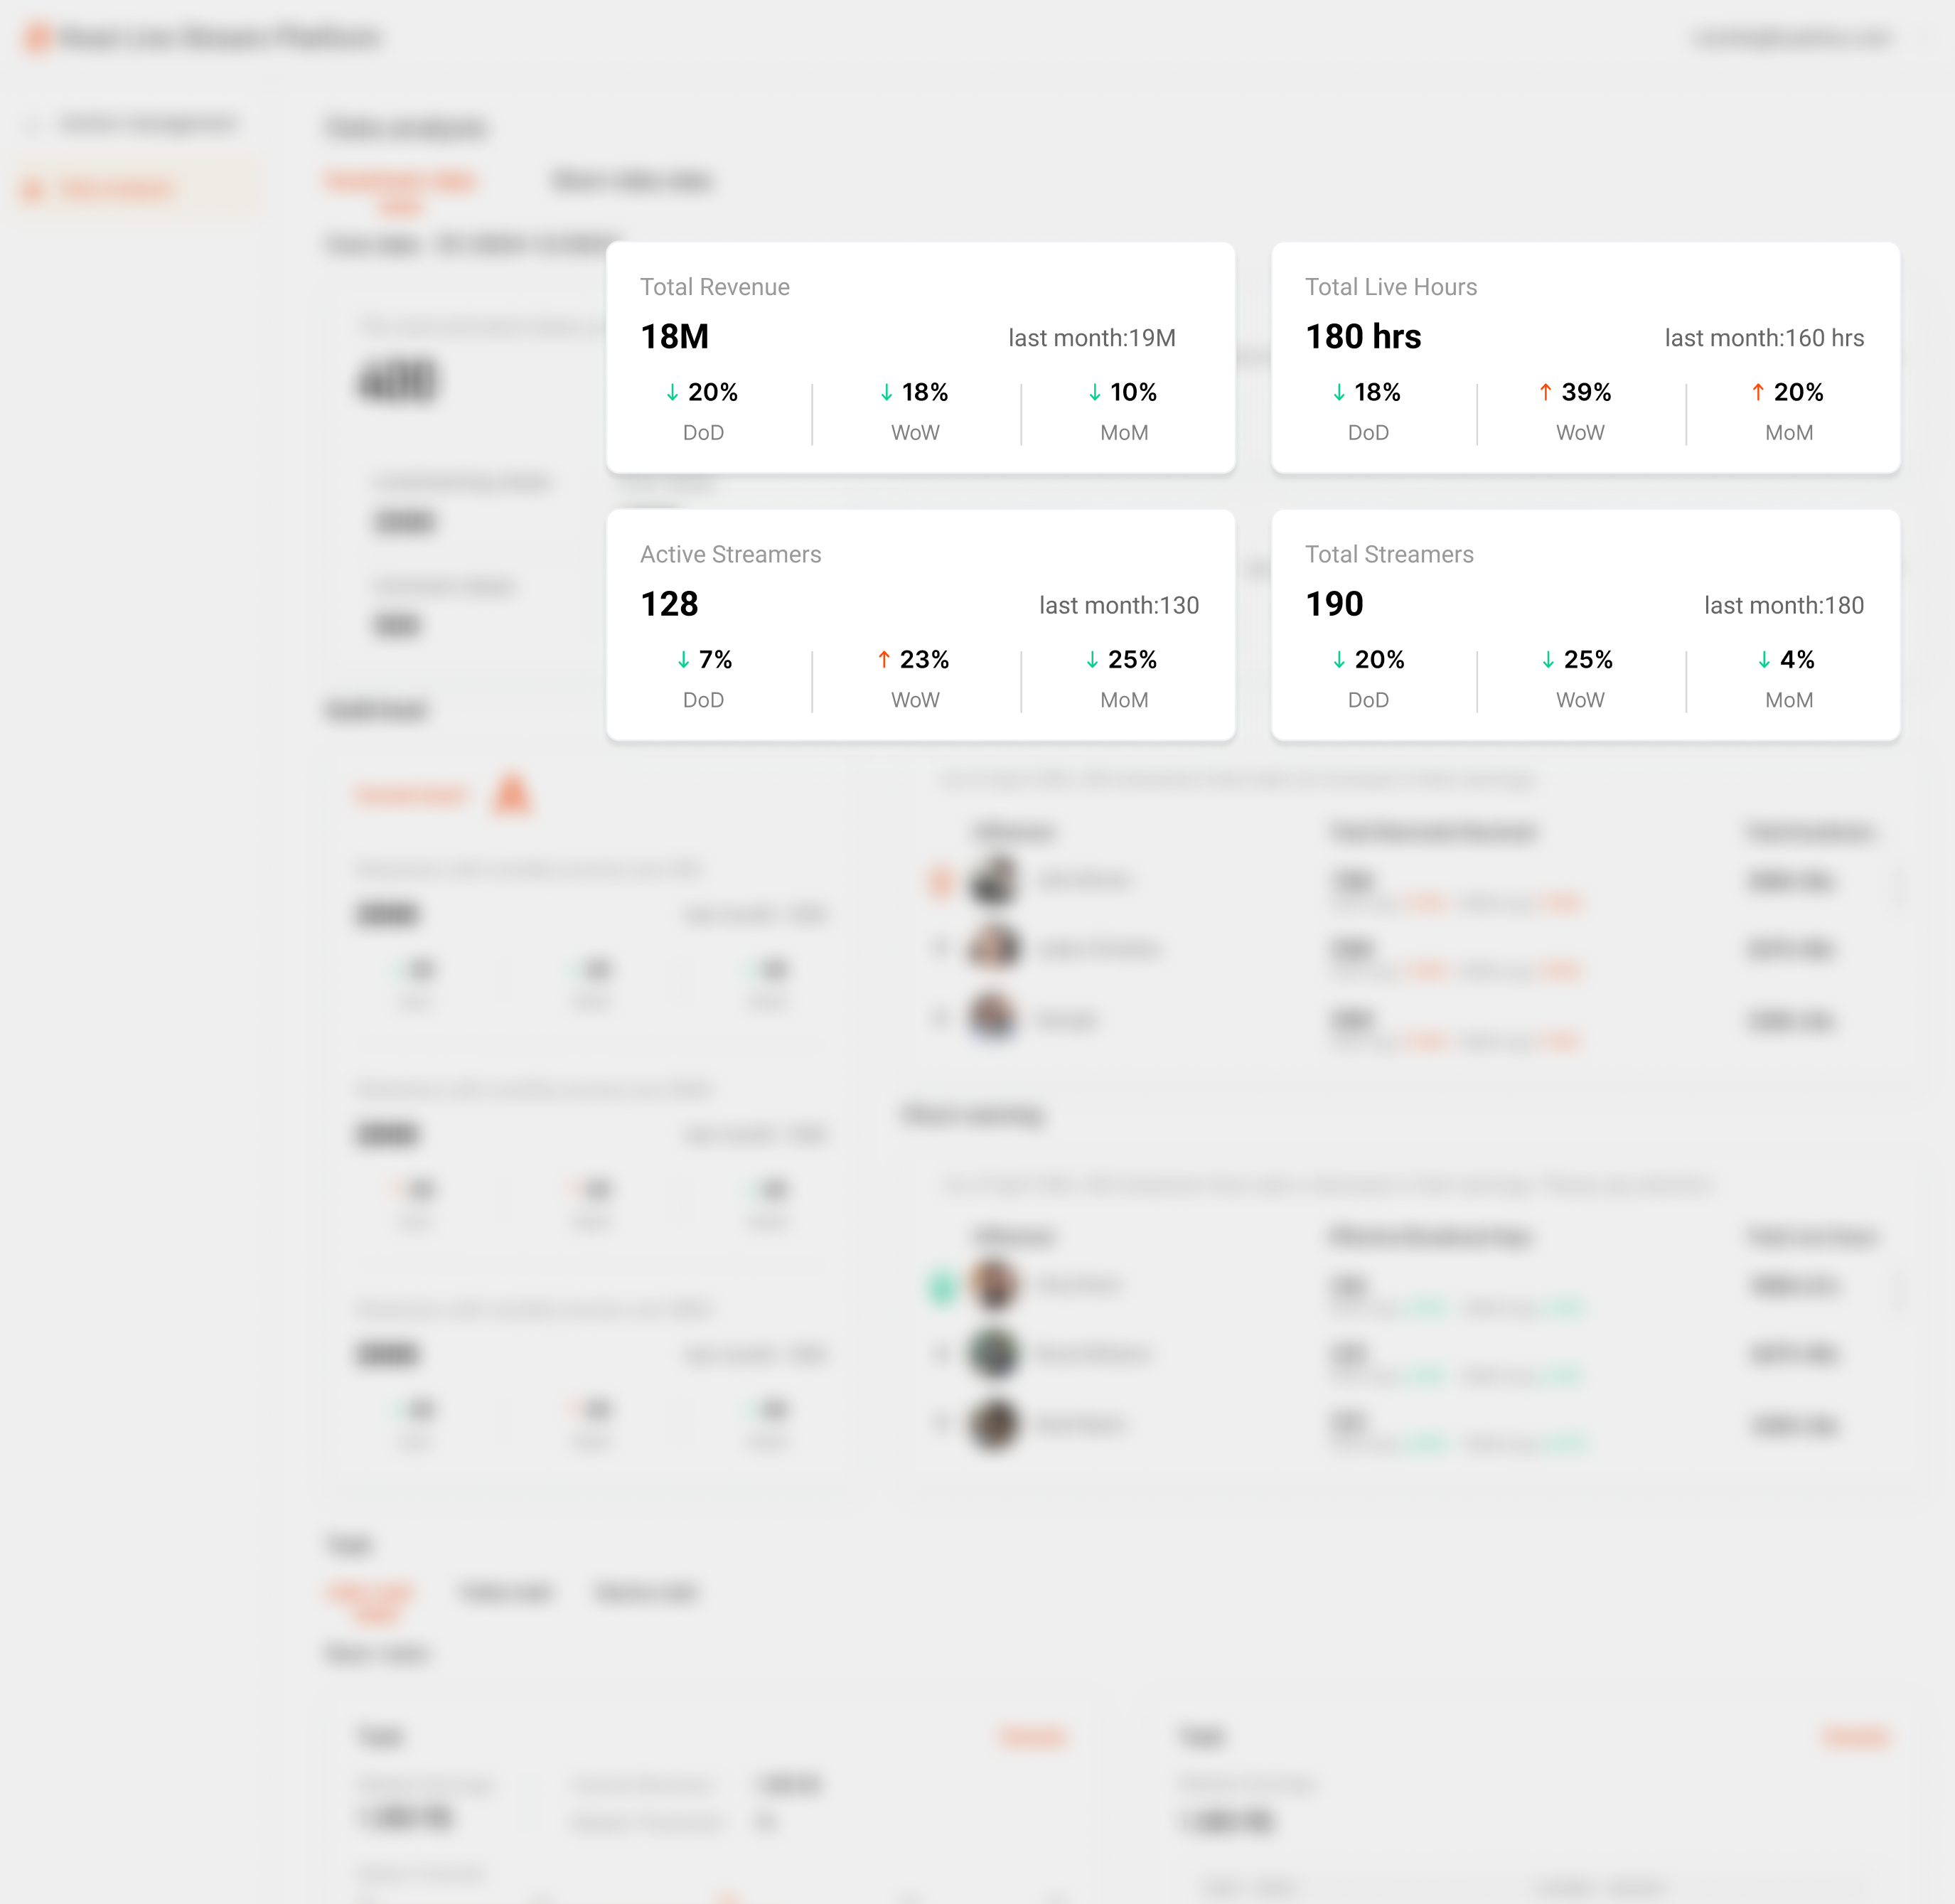
I synced the four headline metrics — Total Revenue, Total Live Hours, Active Streamers, and Total Streamers — and gave each one Day-over-Day, Week-over-Week, and Month-over-Month deltas, so a manager reads momentum at a glance instead of reconstructing it.
Each card pairs the current value with last month's, then splits momentum into three deltas — color-coded green for up and red for down. A manager reads both direction and speed at a glance, with no exports or spreadsheets in between.
View 02
Tier classification
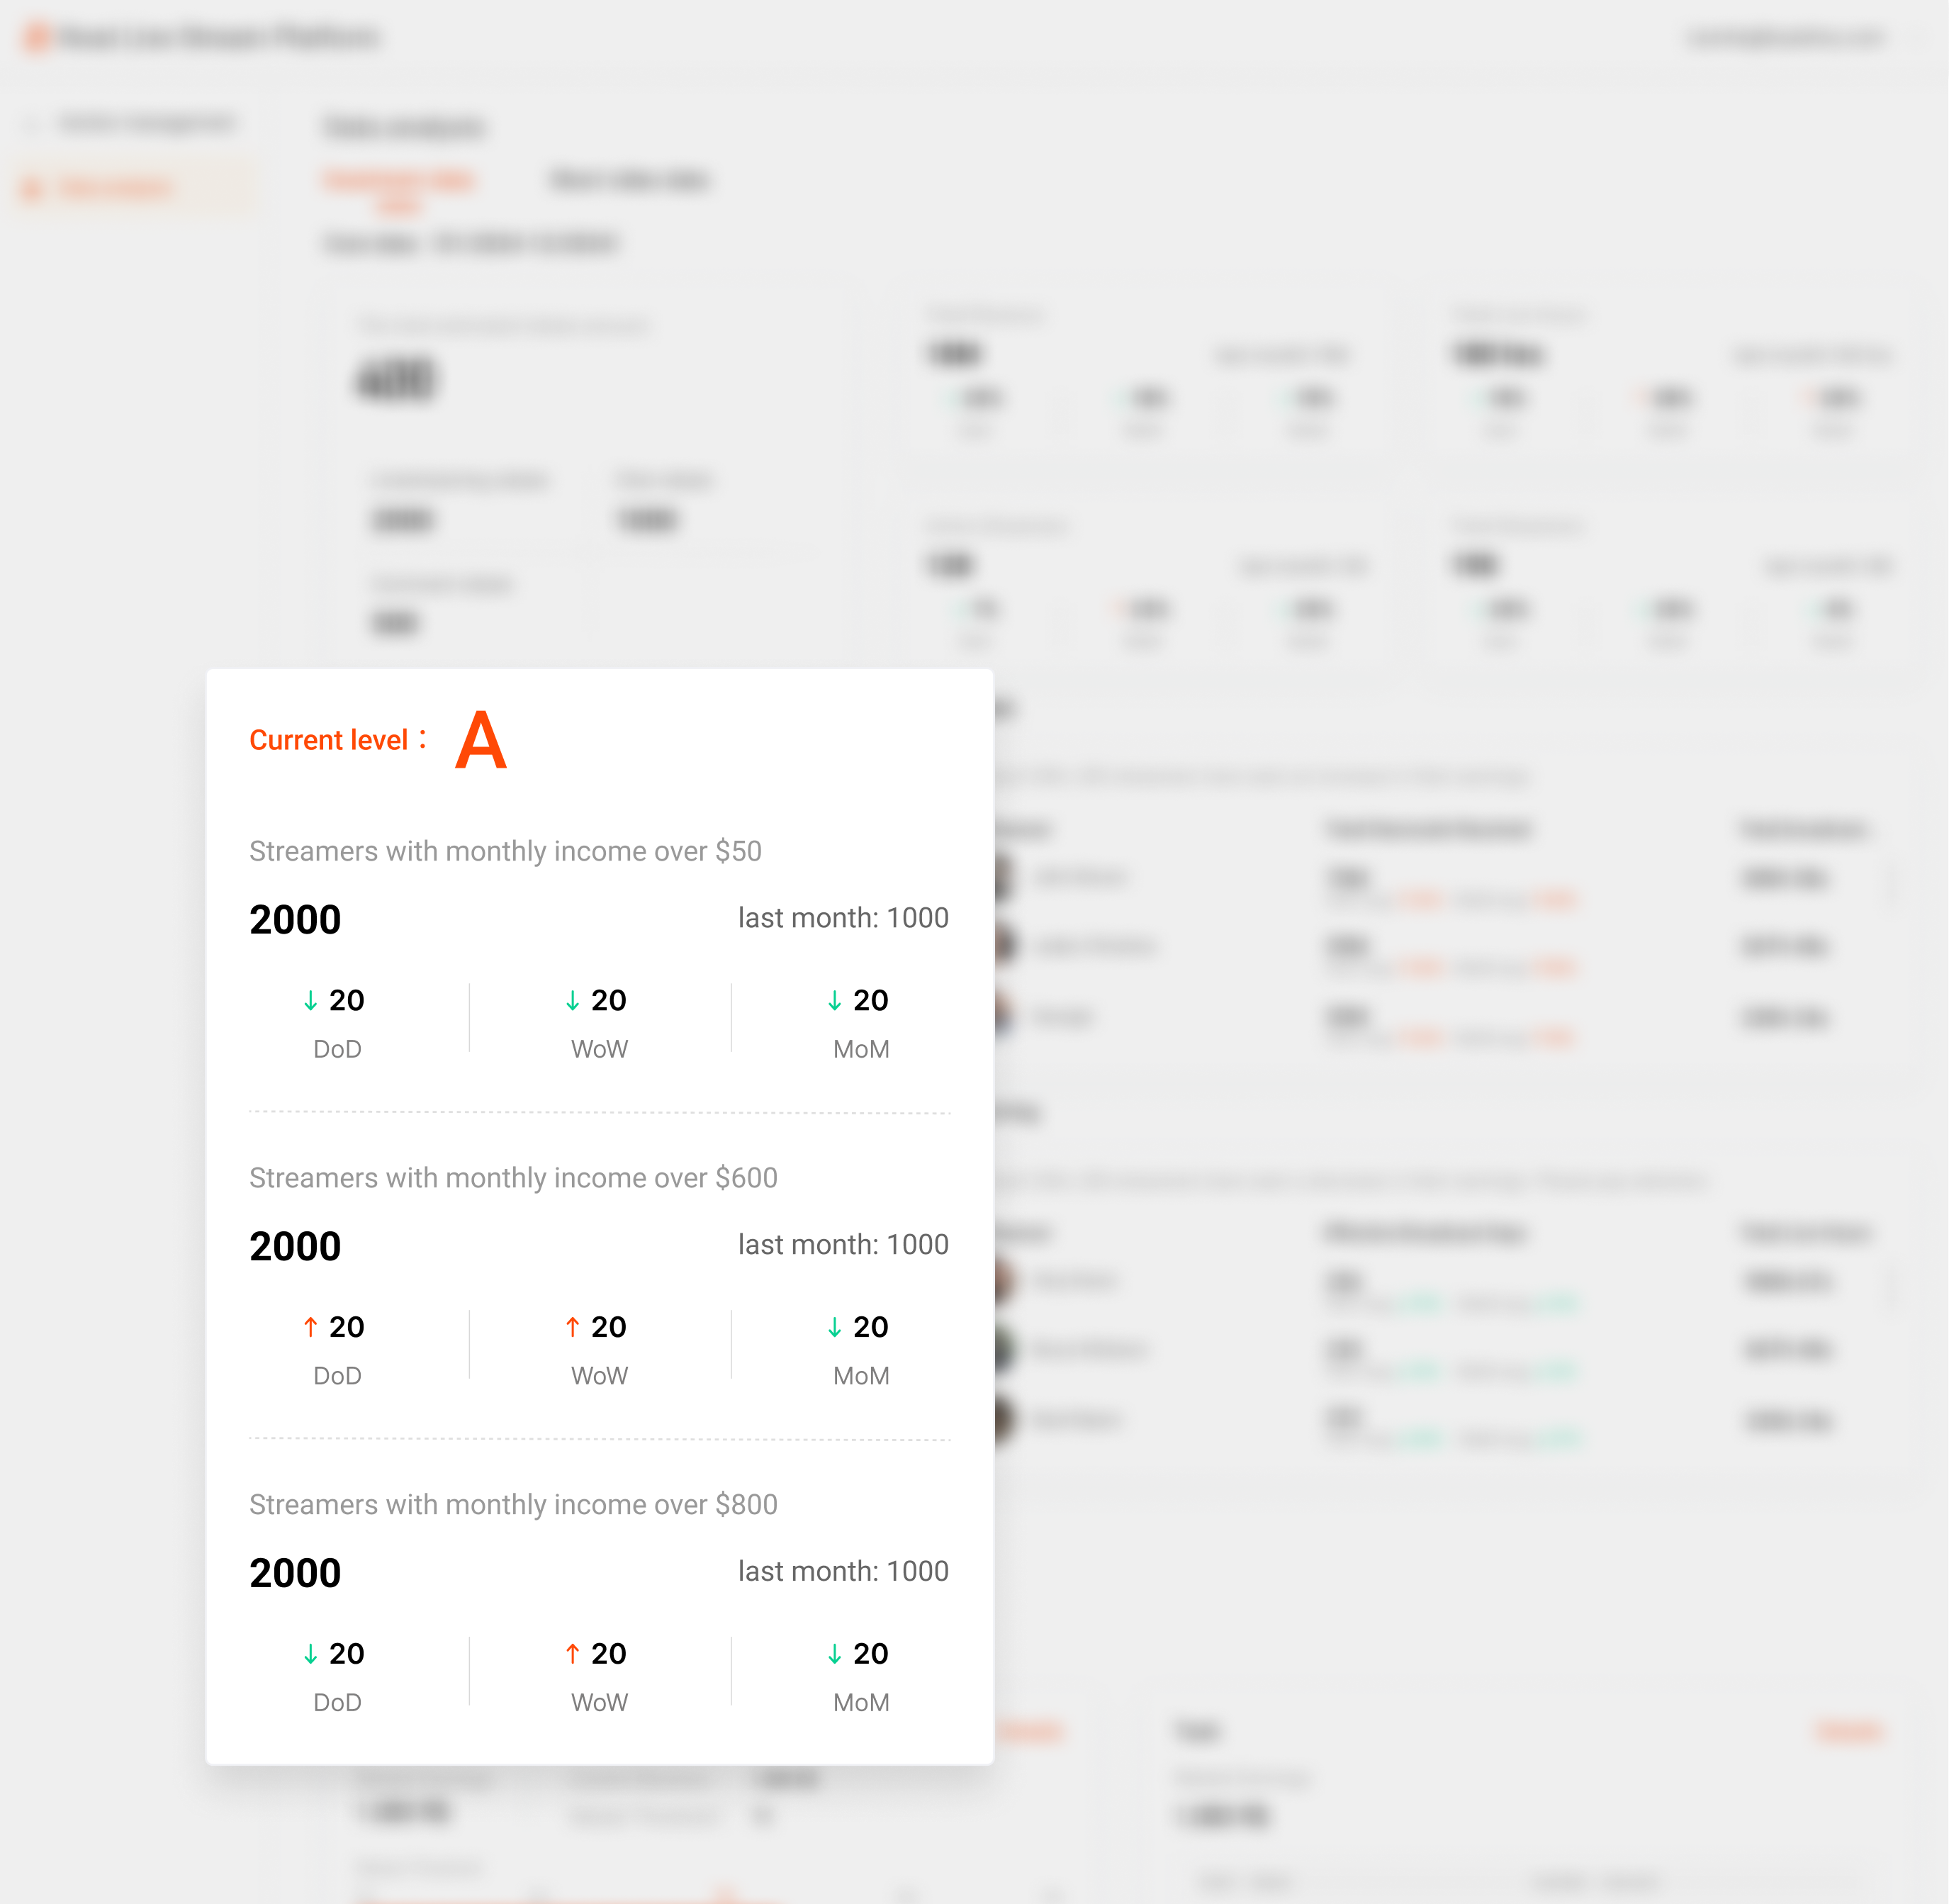
The platform rates each guild on its streamers' performance and sorts streamers into three income tiers — $50+, $600+, and $800+ monthly — so managers always know where a guild stands and who to invest in.
The guild's current level sits up top. Below it, the count of streamers clearing each threshold, each carrying its own trend — so a manager sees not just how many streamers earn well, but whether the distribution is climbing or slipping.
View 03
Top this month
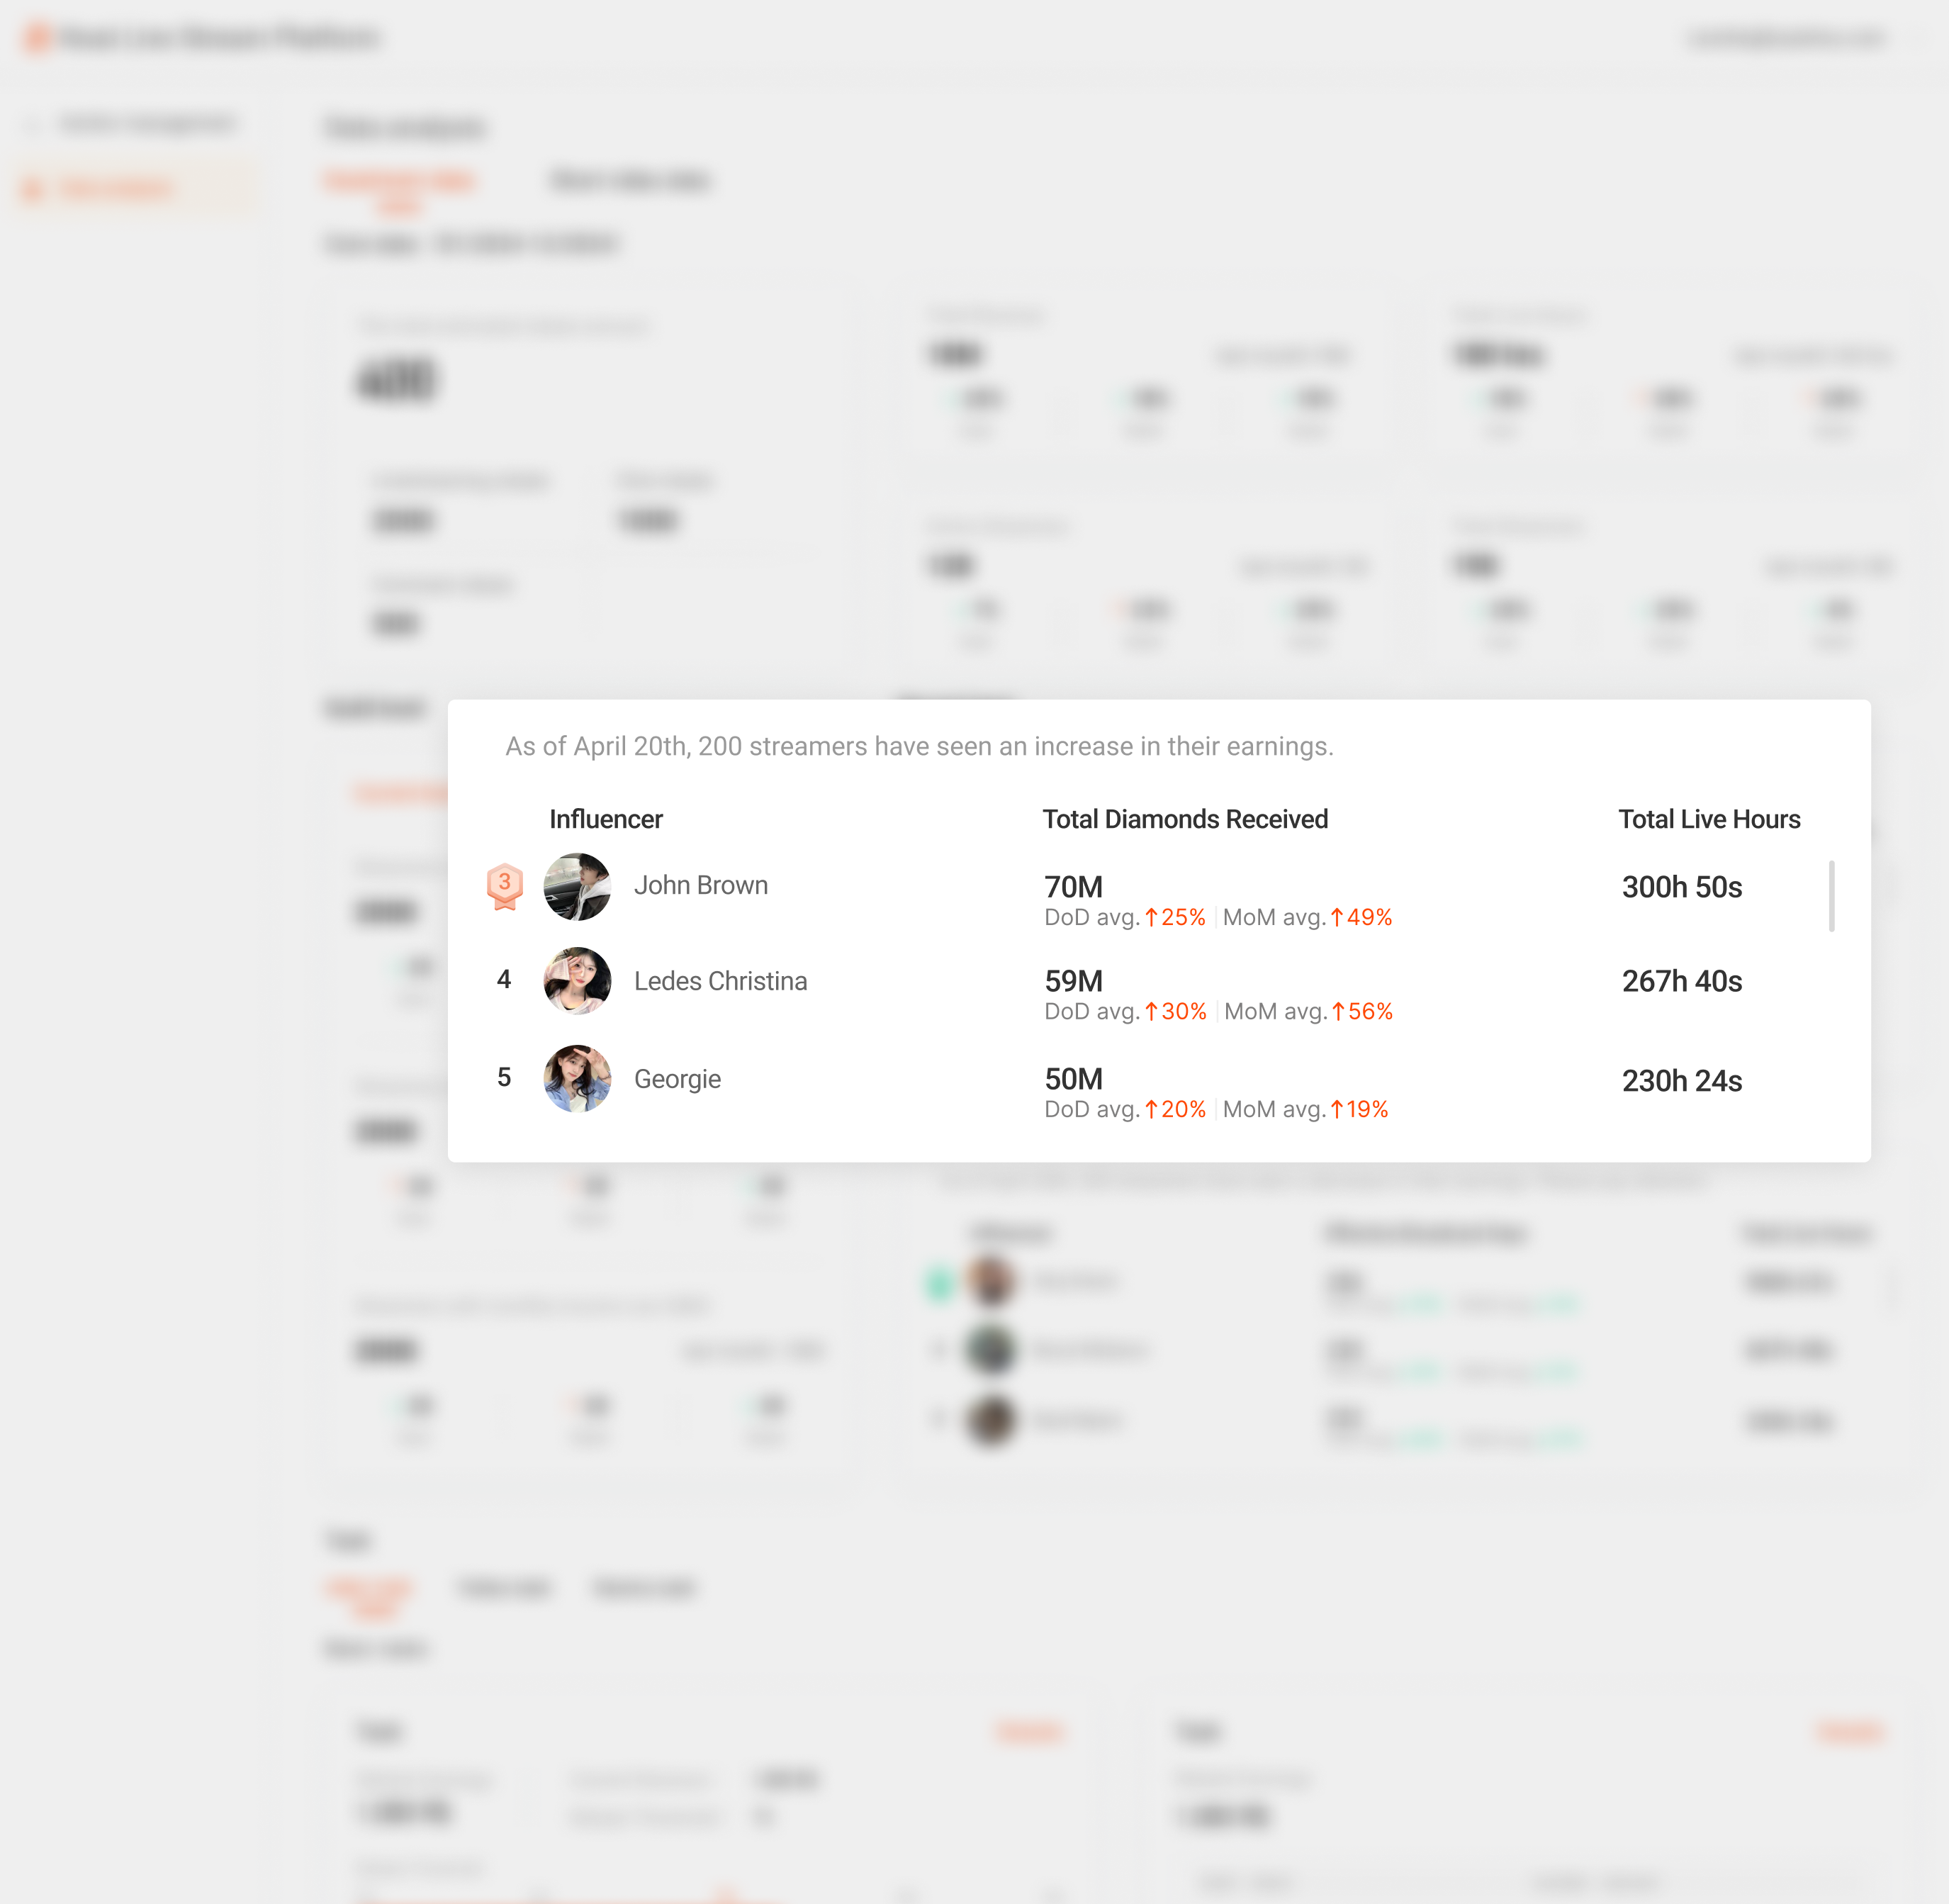
A ranked Top 10 — the highest week-over-week growth among streamers clearing 10M diamonds — with gift contributions quantified, so wins are easy to spot and reward.
Each row shows total diamonds and live hours next to the growth figure, so a manager can separate a streamer who's genuinely accelerating from one simply putting in more hours — and reverse-engineer what the top of the roster does that the rest could copy.
View 04
Churn alert
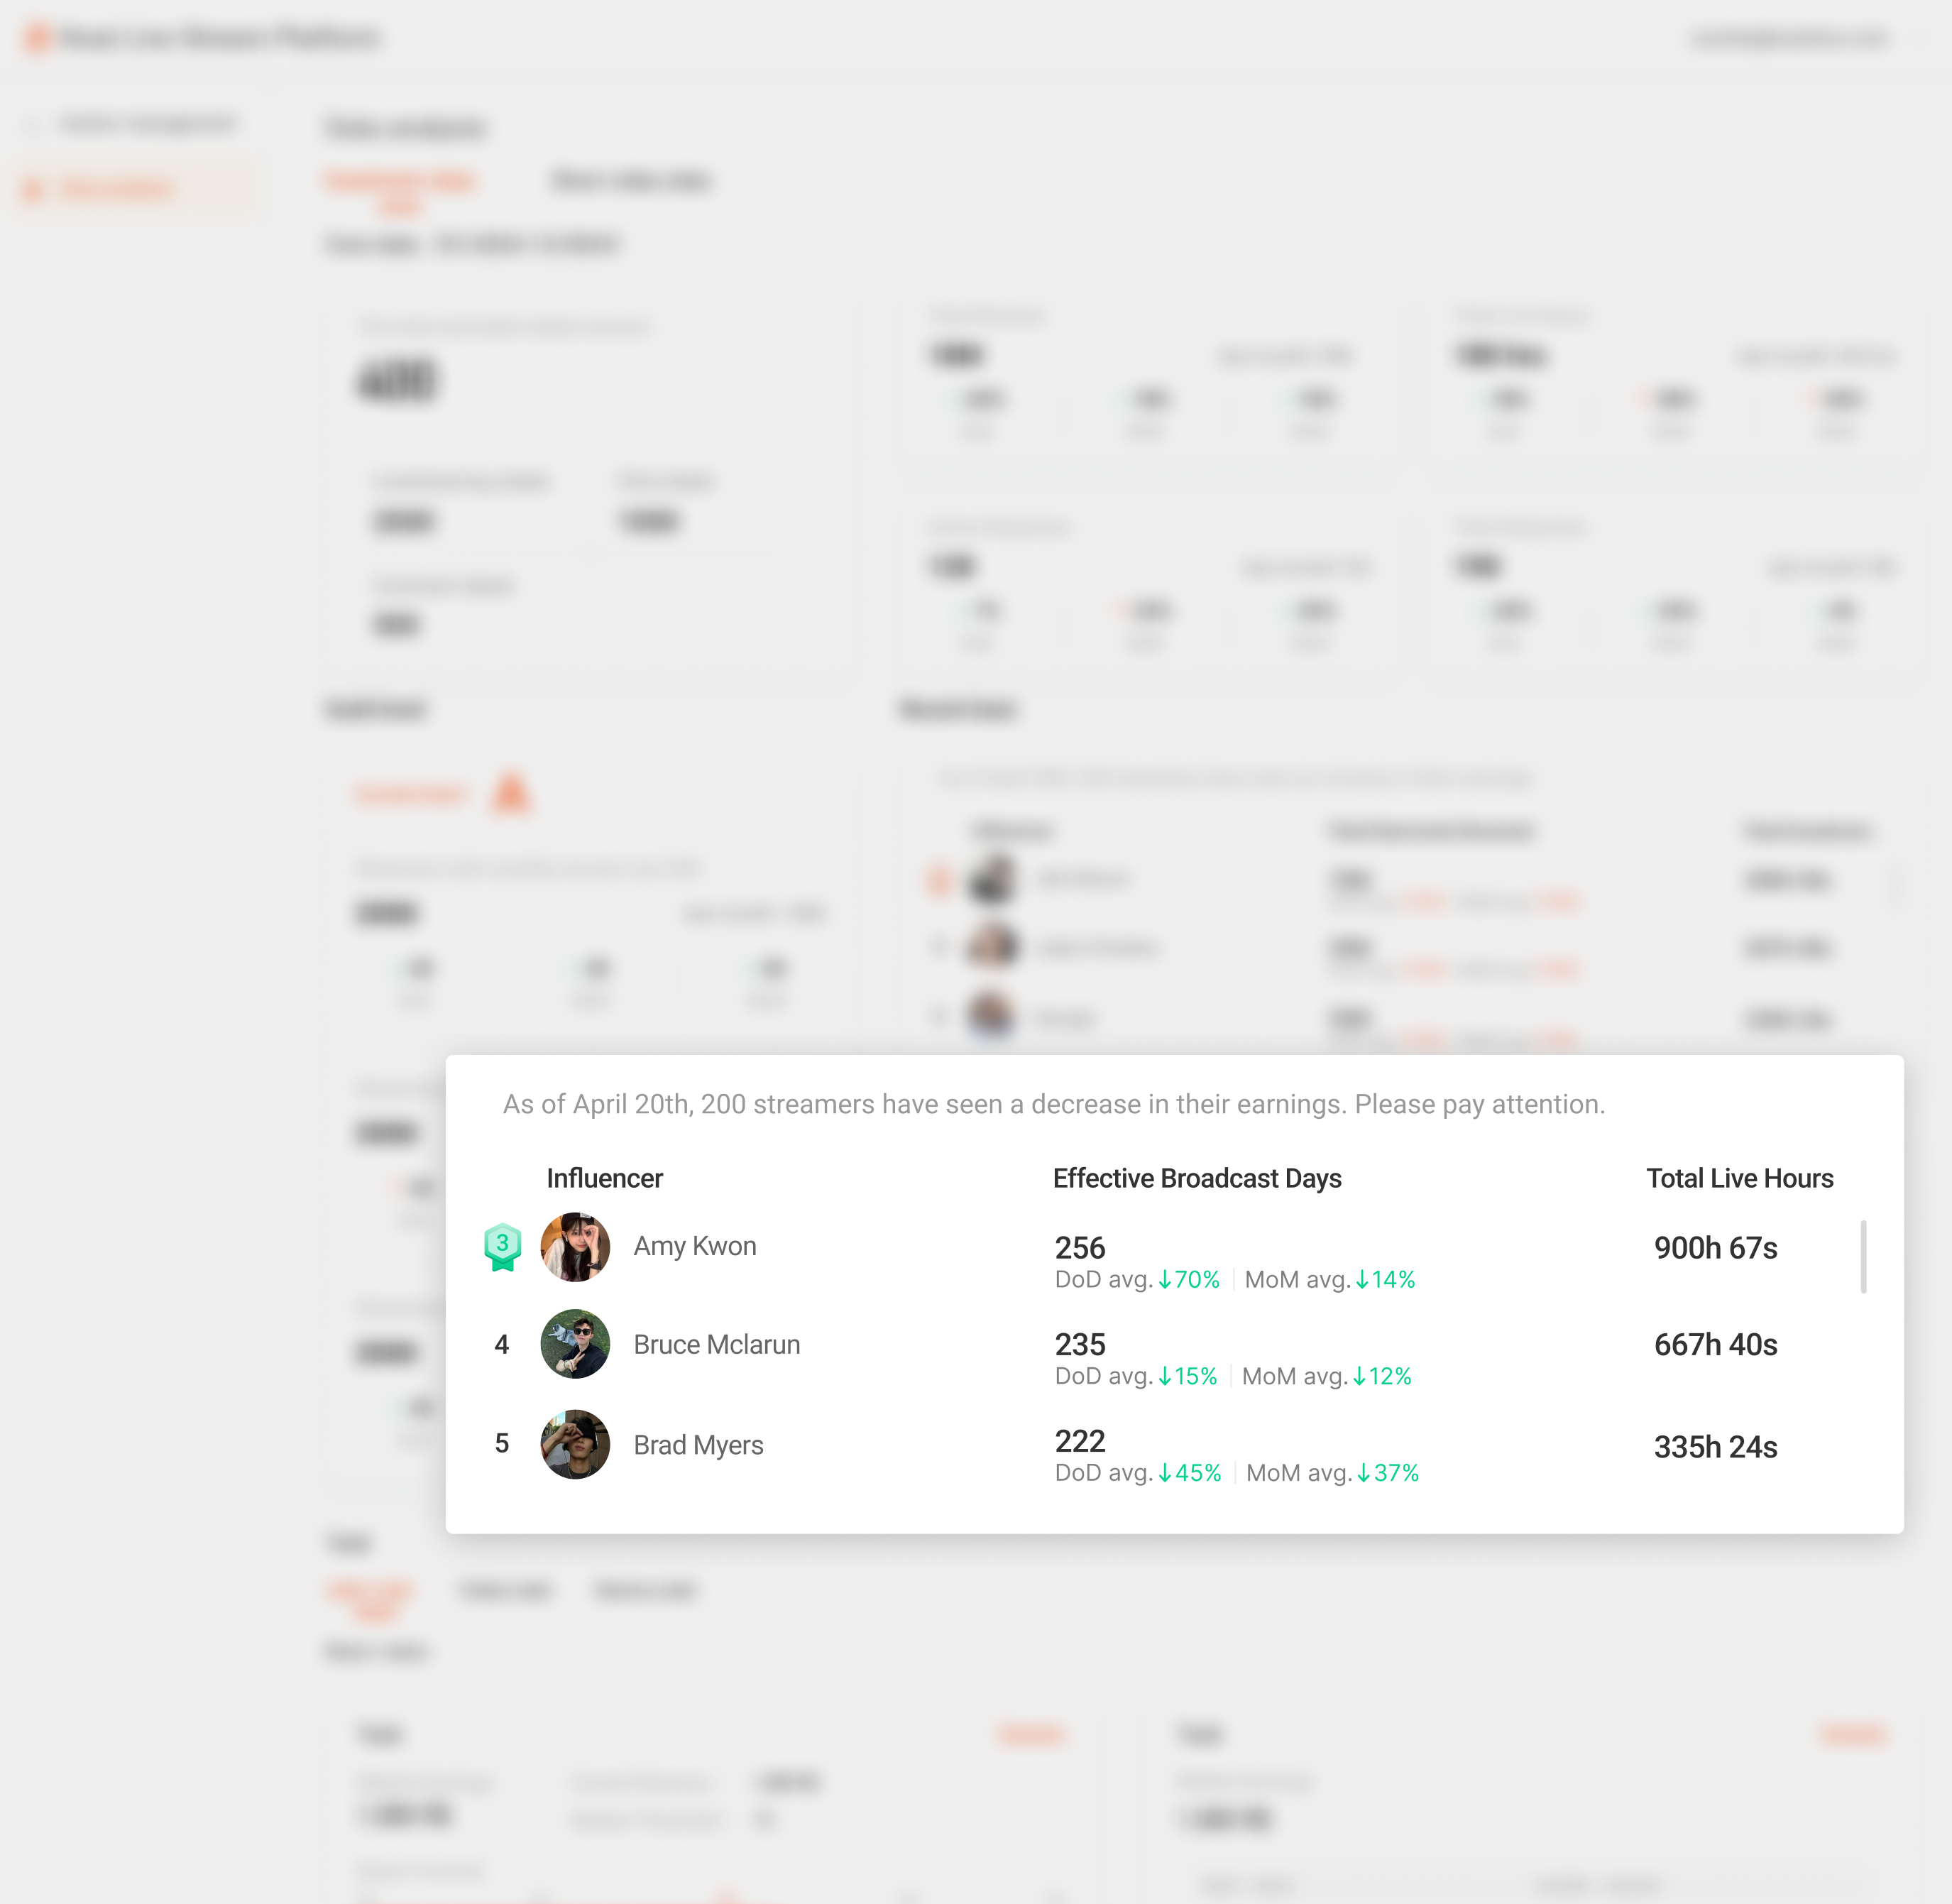
The piece that changes the workflow: the Top 10 at-risk streamers by income drop, with Effective Broadcast Days alongside, so managers can step in while it still matters.
It's the mirror image of the top-performer view, and the one managers open first. Surfacing decline before a streamer goes dark turns the dashboard from a report into a prompt to act.
Impact
From 20 minutes to 7, and 20% more retention.
Faster at-risk spotting
Streamer retention
More decision confidence
The alert system cut the time to identify an at-risk streamer from roughly 20 minutes to 7 — a 65% drop — and retention in top-performing guilds rose about 20% the month after launch. In internal surveys, managers reported a 40% lift in confidence when making tier and promotion calls.
“The new dashboard saves me so much time. I can see instantly who's improving, who's slipping, and where to focus — and the churn alerts let me act early instead of after it's too late.”
“Tracking at-risk streamers and surfacing top performers has helped me retain talent and motivate the team. I finally have real data to guide the conversation.”
“Before this, we pieced everything together by hand. Now revenue, live hours, tiers, and trends sit in one place — and I feel far more confident planning promotions.”
Reflection
Designing for decisions, not just data.
This project was a turning point in how I think about designing for decisions. Unlike a consumer interface, this dashboard served guild managers who needed both clarity and control to act on fast-changing performance data — and it had to earn their trust every time they opened it.
The biggest takeaway was learning to balance information density with usability. I had to stop asking “how do I visualize this data?” and start asking “what decision should this view enable?” — and that shift reshaped the information architecture and which metrics to lead with.
Through interviews and iteration I also came to appreciate the role of predictive design. The churn alert was more than a feature — it moved the product from passive reporting to proactive intervention, and pushed me past the UI into system thinking: how data flows, what should trigger action, and how to put the right signal in front of the right person at the right time.