- EdTech
- AI
- B2C
A Trackable Parent Dashboard
Transforming raw tutoring data into clear, actionable progress insights that help parents understand, support, and stay engaged in their child's learning journey.
- Role
- Product Builder
- Team
- CMU METALS Capstone× Varsity Tutors
- Tools
- FigmaFigJam
- Timeline
- 8 weeks2025
The brief
Turn each session transcript into signals parents can act on.
Motivation
Varsity Tutors is a subscription tutoring marketplace for grades 10–12, where renewal is the core business metric — and the parent is the one who decides whether to renew.
Challenge
But parents never really see the product. All they get is a raw session transcript — long, unstructured, mapped to no learning framework — so they can't tell whether it's working. The result is silent churn: parents who quietly stop renewing because they can't see learning happening.
Solution
Over an 8-week CMU METALS Capstone, I worked with Varsity Tutors to turn each session transcript into signals parents can act on — so the renewal decision shifts from a guess to a confident yes.
Problem
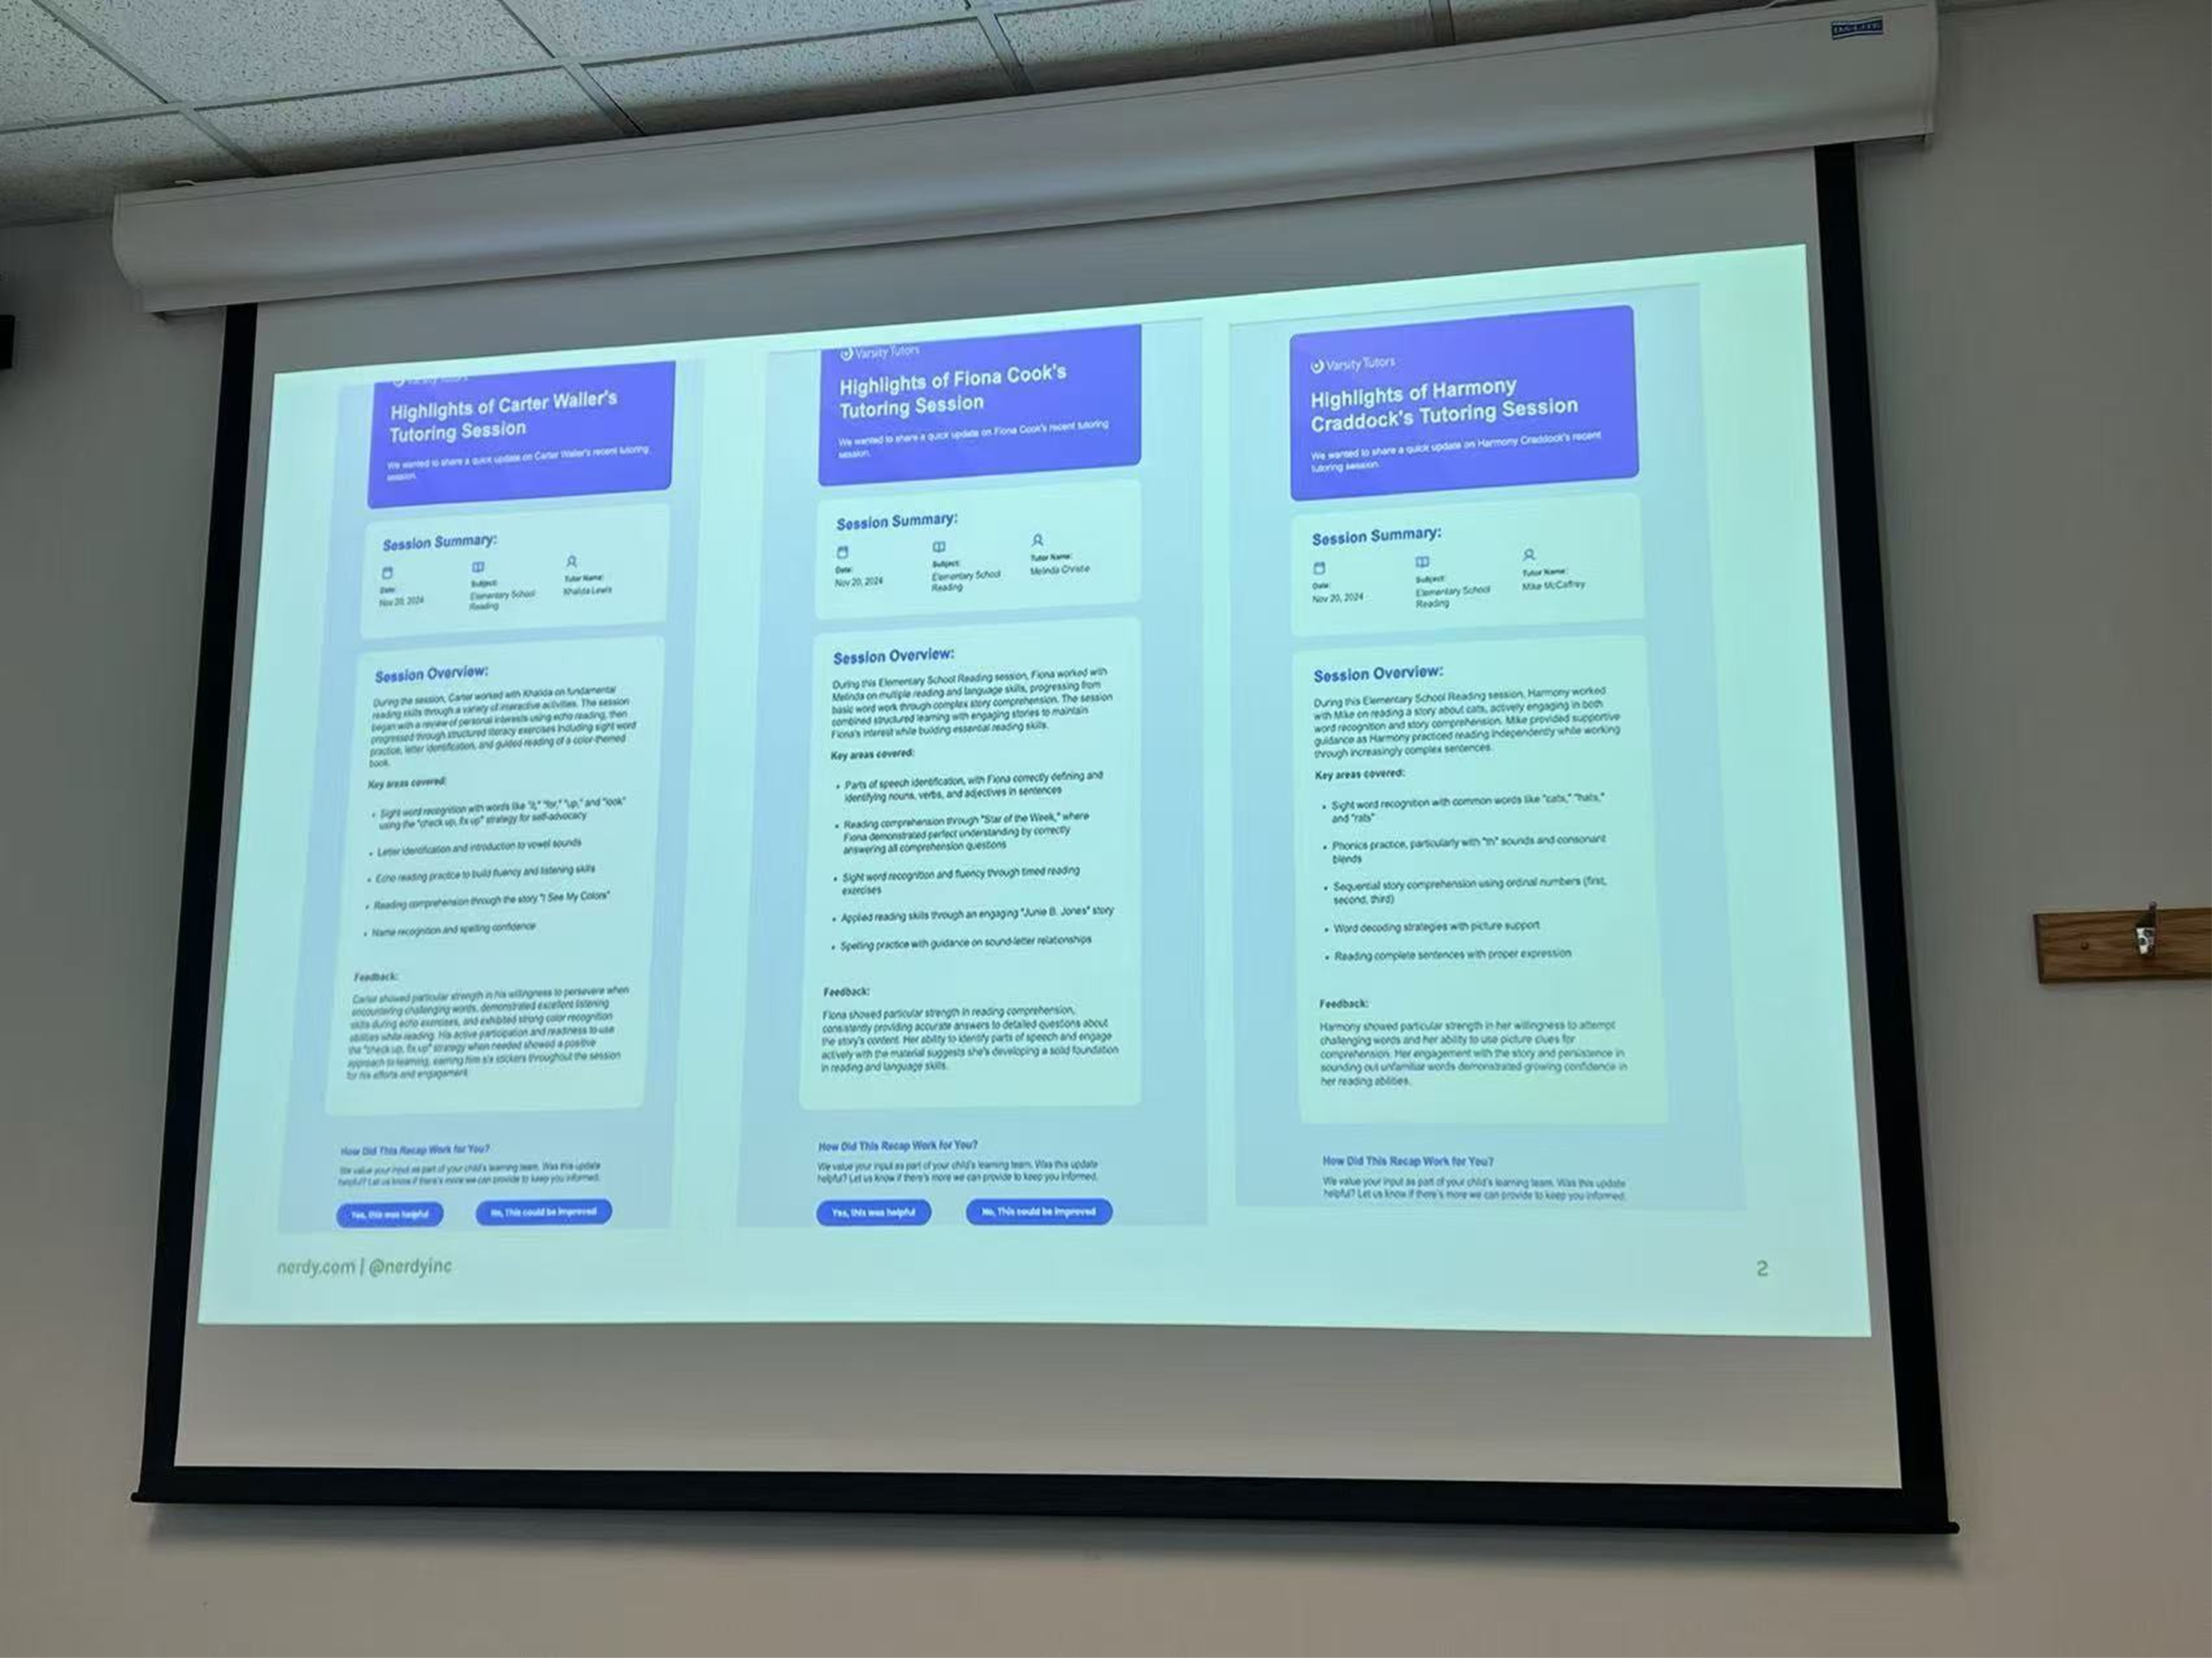
Parents only got a raw transcript, so they just guessed.
Before the dashboard, every session ended in a raw transcript: pages of back-and-forth dialogue with no structure, no learning framework, and no signal of what was mastered or still shaky. To answer “is this working?”, a parent had to read the whole thing — so most just guessed.
Research
Finding where trust breaks down.
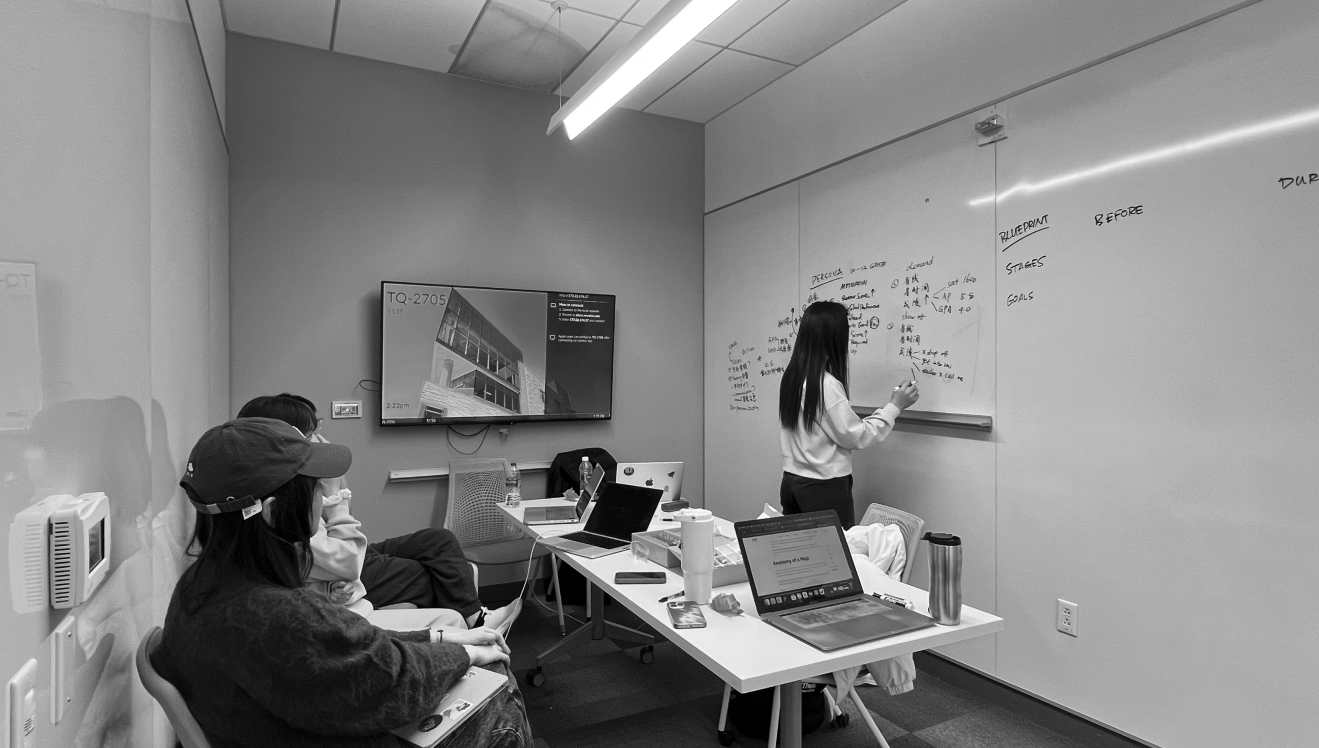
To find where trust breaks down, we triangulated across theory, business, and real users — a literature review of learning-science frameworks, internal expert interviews at Varsity Tutors, a survey of 104 parents, and 1:1 in-depth interviews — to understand what parents care about, what confuses them, and where they feel uncertain.
parents surveyed on how they judge tutoring effectiveness
in-depth 1:1 parent interviews
research lenses — theory, business & real users
What I owned
- Synthesized survey + interview data into the framework below, with the team, via affinity diagramming
- Owned the data strategy — how a raw session transcript maps to skills, mastery, and learning-science principles
- Designed the MVP: homepage, session reports, and an AI-driven skill-mastery breakdown
- Ran 1:1 think-aloud testing and made the hard calls that turned a confusing v1 into an actionable v2
Jobs to be done
What parents hire the product to do
Synthesis pointed to three jobs behind the renewal decision — and the product was failing all three.
The Learning Job
“Tell me whether learning actually happened — not just how many sessions.”
Today parents get a transcript and grades that lag by weeks. They want mastery; the system reports attendance.
The Engagement Job
“Let me see whether my kid is actually engaged — not just present.”
Engagement is the leading indicator parents most want, yet it's completely invisible. That blind spot is the source of silent churn.
The Trust Job
“Give me a stable, honest read. I don't want surprises.”
Trust comes from consistent, transparent feedback. Inconsistent signals quietly erode it between billing cycles.
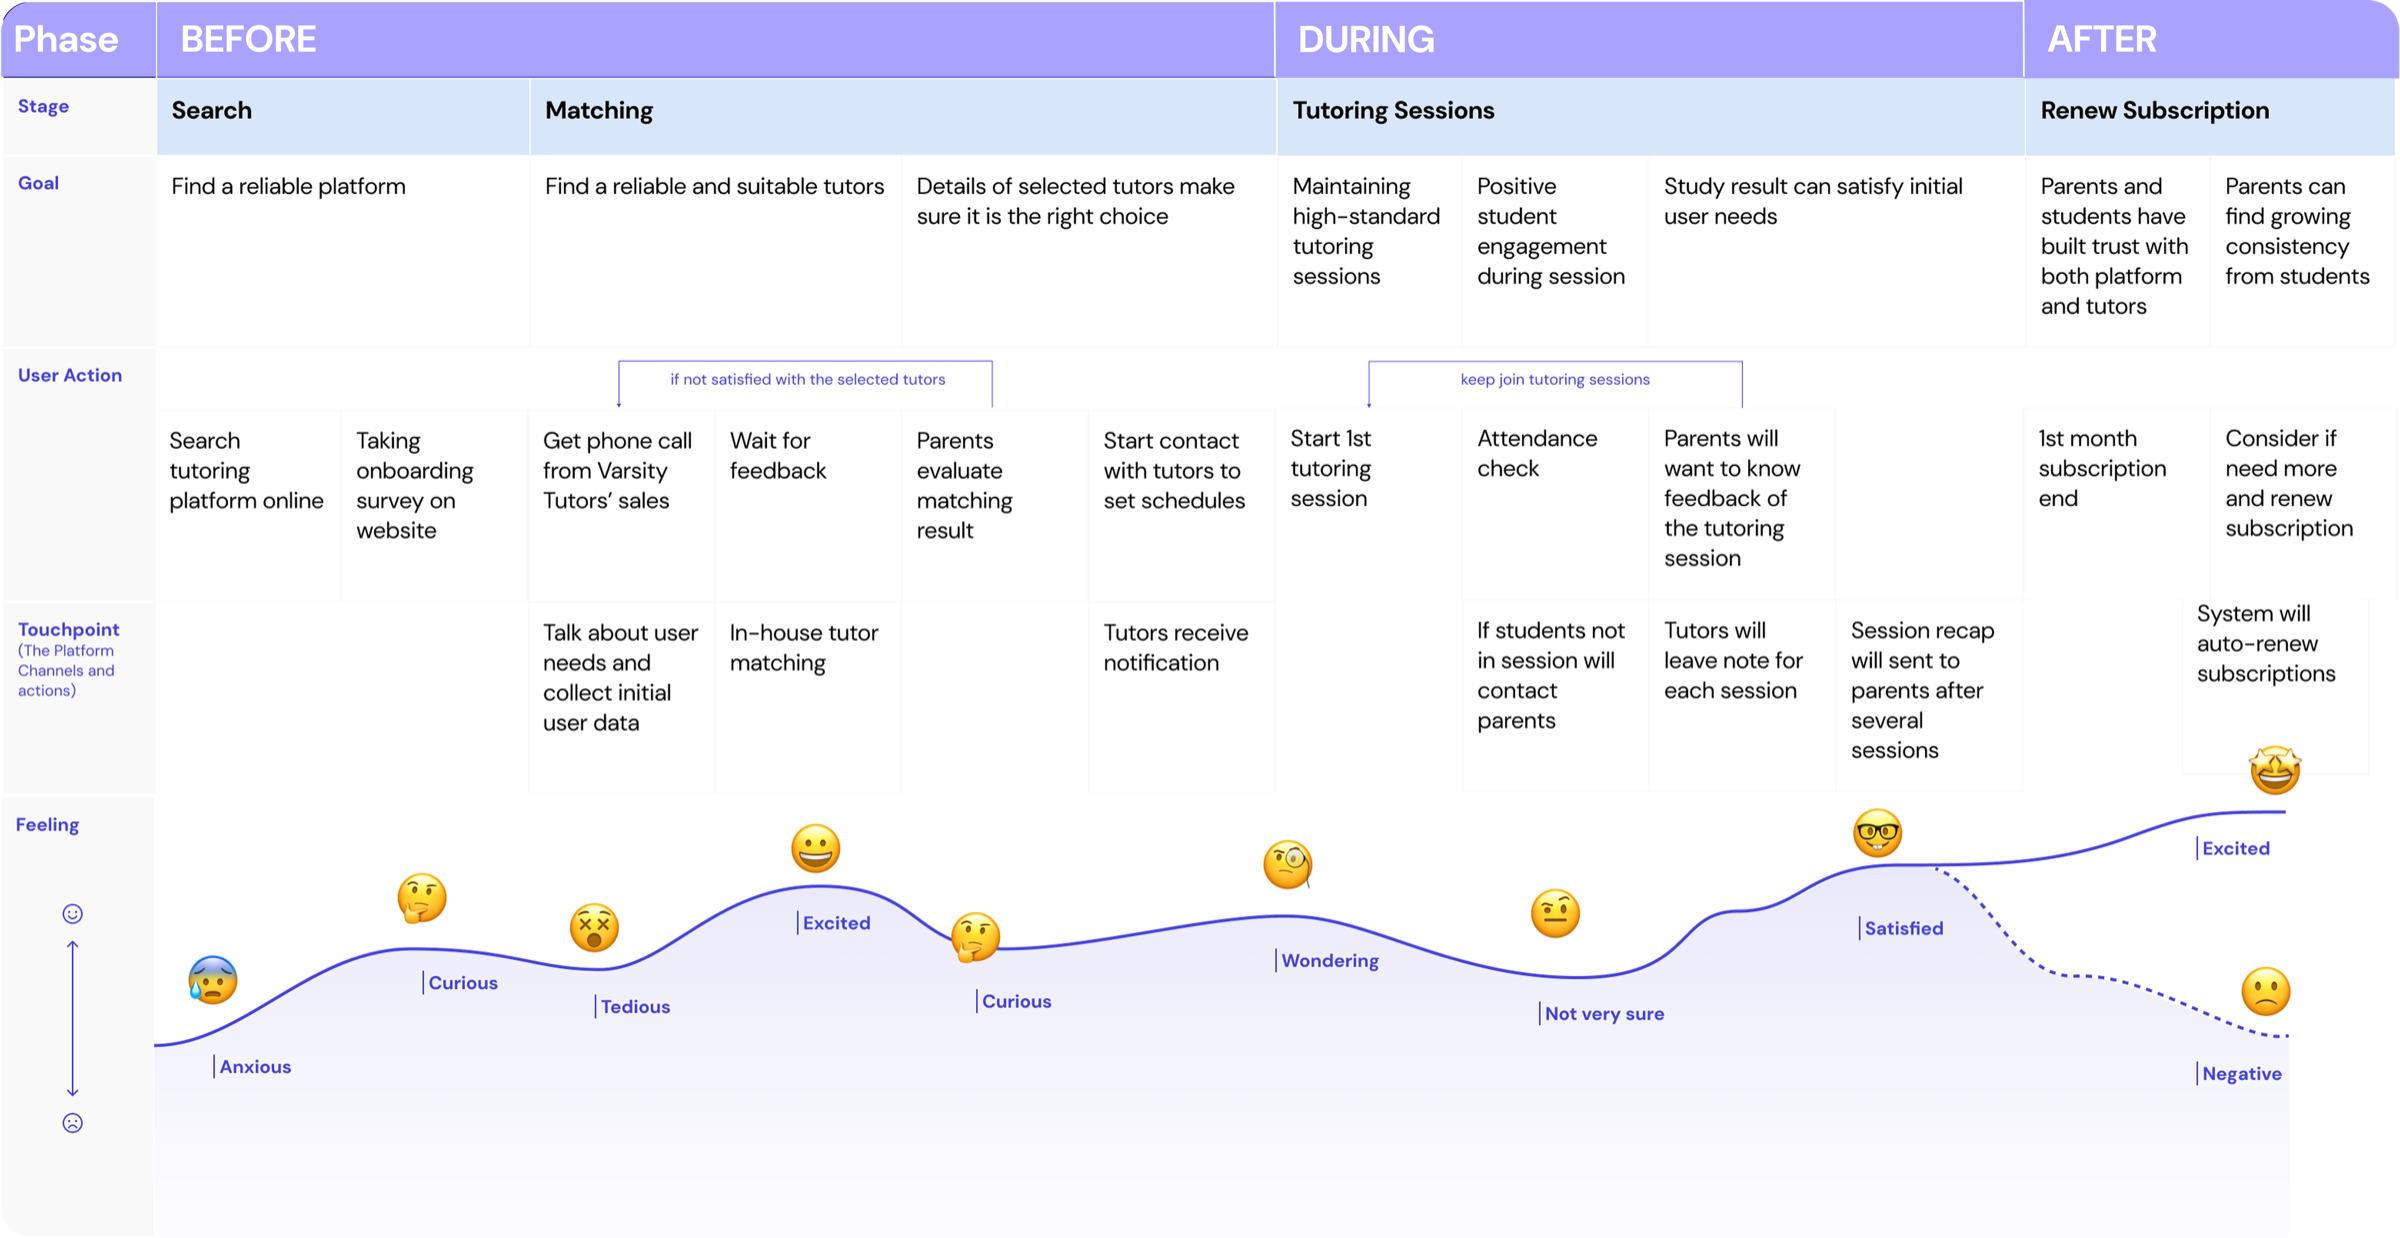
Journey map
Where the journey breaks down
We mapped the full journey from search to renewal and found four pain points — and the biggest gap lands exactly where it hurts most: during and after sessions, when parents most want to understand learning but the system gives the least clarity.
Limited emotional touchpoints
Parents can't feel how engaged or motivated their child is between sessions.
Non-standardized process
Tutoring quality and structure vary tutor to tutor, so 'good' is hard to define.
Communication gaps
Updates are sparse, late, or hard to interpret — confidence erodes instead of building.
No visibility beyond grades
Grades don't show what was actually practiced, mastered, or still shaky.
Key trade-offs
Four decisions where the obvious answer wasn’t the right one.
Getting from problem to product meant four decisions where the obvious answer wasn’t the right one — spanning the co-creation workshop through the final design.
Where to focus
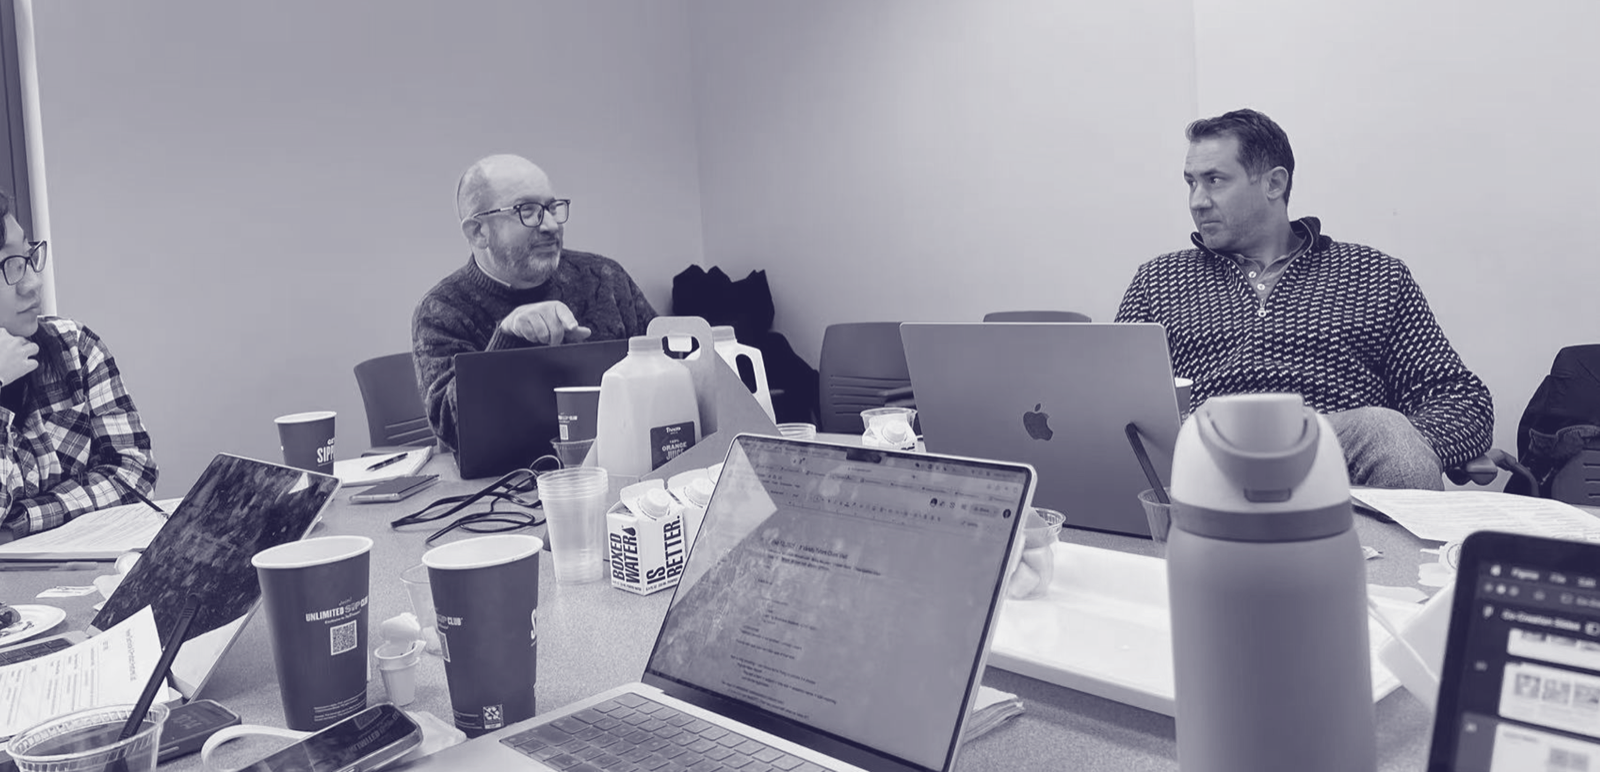
A co-creation workshop with the Varsity team surfaced three candidate bets. Which one moves renewal fastest at this product stage?
Considered
- Standardize the tutoring process
The business's first instinct — better quality at scale. But it needs deep changes to tutor workflows and internal systems; too slow to ship now.
- Add communication touchpoints
More notifications and summaries add information, not understanding — they don't touch the core problem.
- Emotional touchpoints + visibility into learning · chosen
Lives in the parent-experience layer — no system rebuild, but the most direct impact on perceived value and trust.
Decision
Emotional touchpoints + visibility into learning. It was the fastest path to the thing that actually drives renewal — how parents perceive value and trust — without re-architecting the platform.
↑ Impact on trust & renewal
System change / effort →
How to structure the dashboard
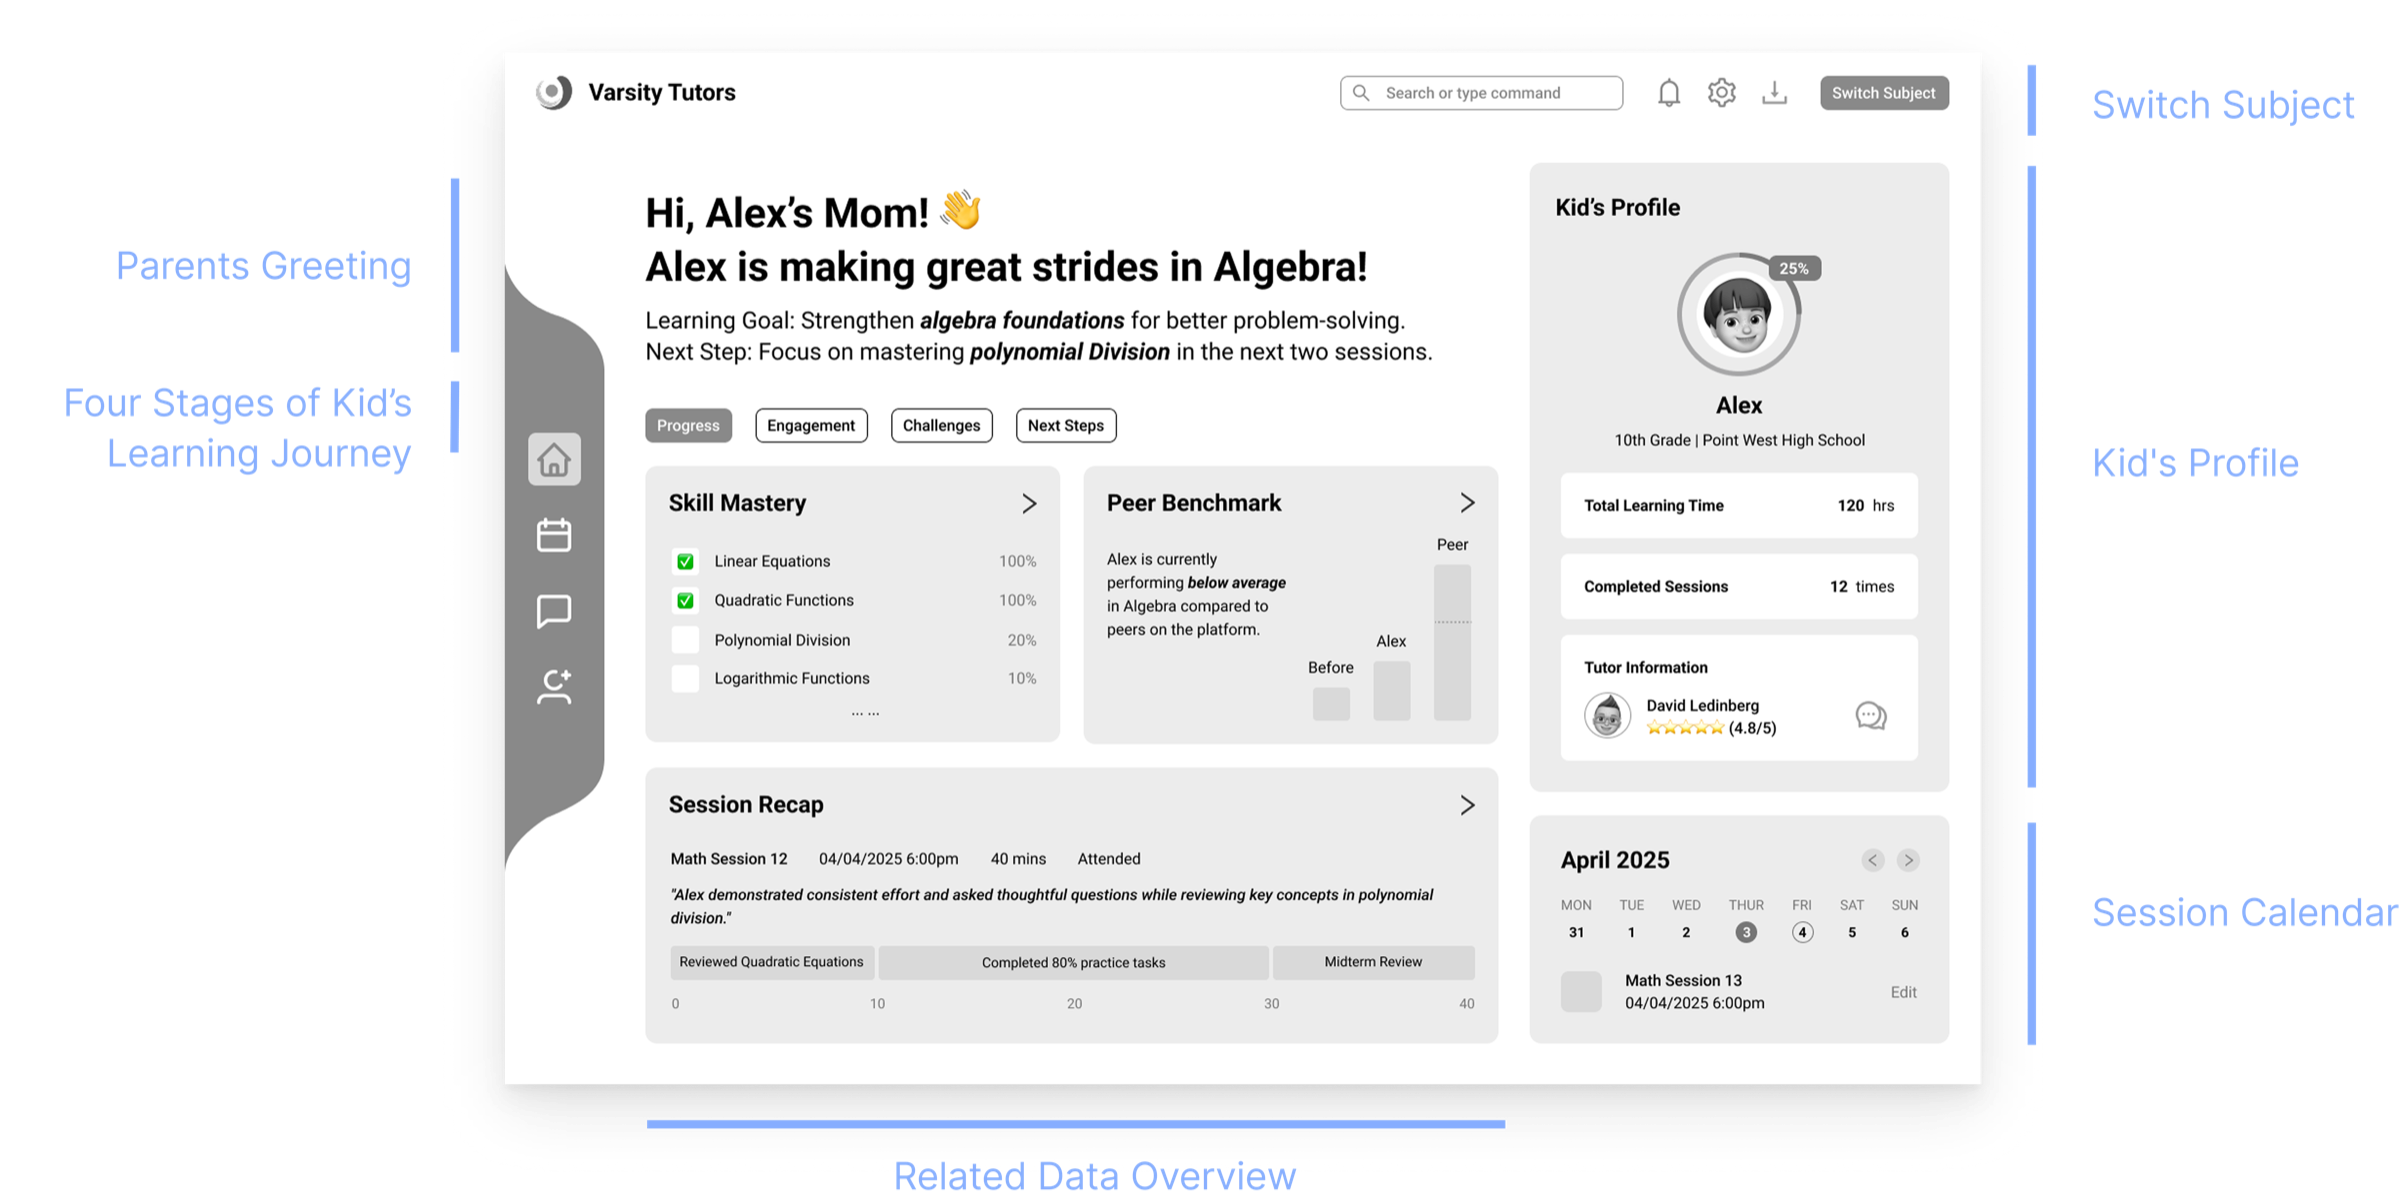
My first lo-fi mapped each How-Might-We question to its own section. Tidy on paper — but parents don't come to read content, they come with a question.
Considered
- A section per HMW question
Clean taxonomy, but it forced parents to assemble the answer to 'how is my child doing?' themselves.
- Question-first: Progress + Engagement · chosen
Two entry points mirroring the two questions parents already ask. Mastery + next-steps under Progress; emotional signals + updates under Engagement.
Decision
Two question-first entry points — Progress and Engagement. Parents start from the question already in their head, then drill down — instead of doing the system's synthesis work for it.
The emotion self-report feature
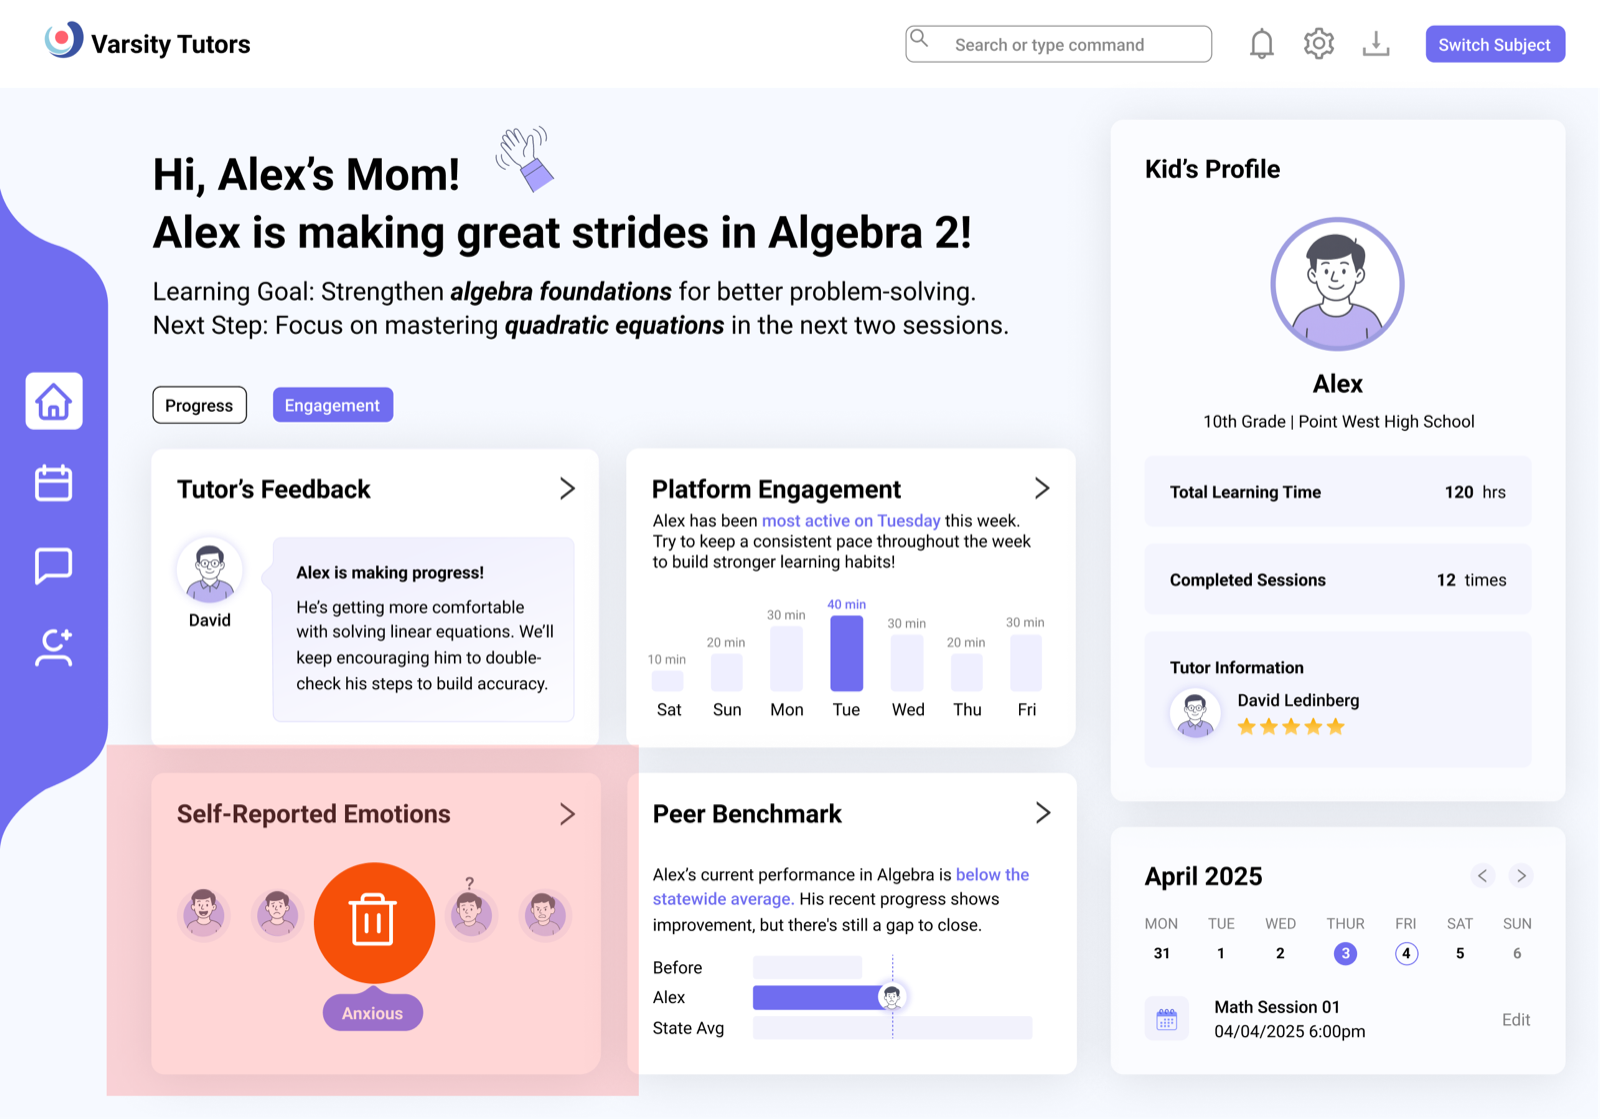
Early research said parents wanted to know how their child felt after each session, so we built a student emotion self-report. In testing, the feedback split — some parents doubted kids would report honestly.
Considered
- Keep it — parents asked for emotional signal
Satisfies a stated desire, but rests on data of questionable reliability.
- Remove it · chosen
Unreliable self-reports could mislead parents and damage the exact trust we were building.
Decision
Cut the feature. Trust and data quality over more information. Parents could still read engagement from other, more reliable signals — so the feature's cost outweighed its benefit.
How to express mastery
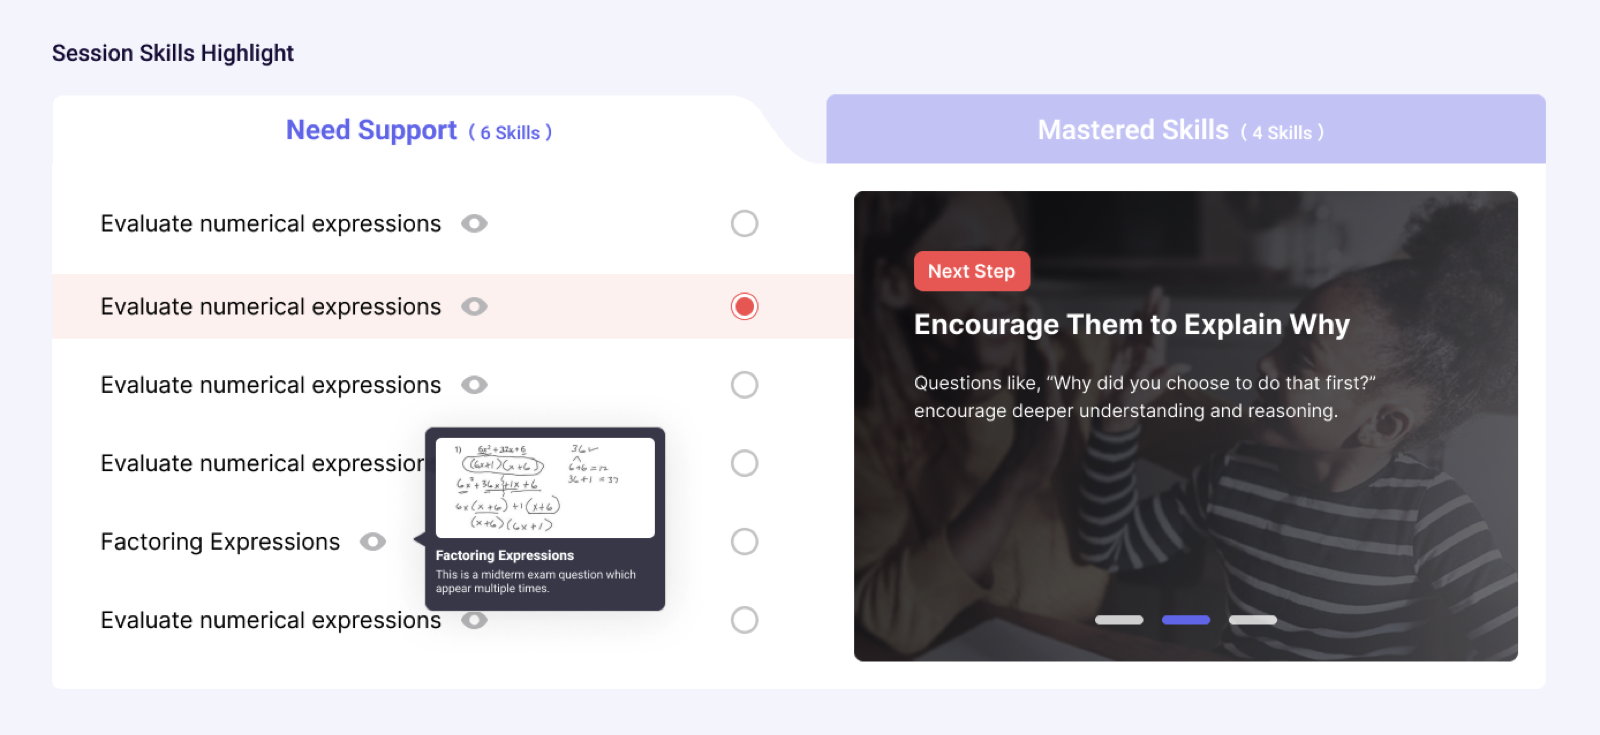
How do we answer 'how much has my child mastered?' in a way parents actually trust?
Considered
- Continuous scores / a more complex model
Precise, but internal testing showed it wasn't transparent — parents couldn't tell what a number meant.
- Clear, interpretable levels · chosen
Mastered / Familiar / Need Support, with plain hover explanations and the accuracy + practice-count logic behind each.
Decision
Interpretable mastery levels over raw scores. An interpretable signal parents trust beats a precise one they can't read.
Iteration
The problem wasn’t the data. It was the structure.
We tested the first MVP with four parents of students in grades 5–8, think-aloud. Three issues came up every time: parents didn't know where to start; the information felt scattered, abstract, or too technical; and the biggest one — “I understand it, but I still don't know what to do next.” The problem wasn't the data. It was how the data was structured and how action was guided. That reframed the MVP around three jobs:
Find
Help parents quickly locate the key information.
Understand
Make the data easy to grasp — plain language over jargon.
Act
Always make the next step to support their child obvious.
Explorations
Five to six structures, compared
Before landing here, we explored five to six information structures — session-centered, skill-centered, and emotion-signal-first — and compared them on clarity, focus, and how well each guided action. The winner mirrored how parents actually make decisions.
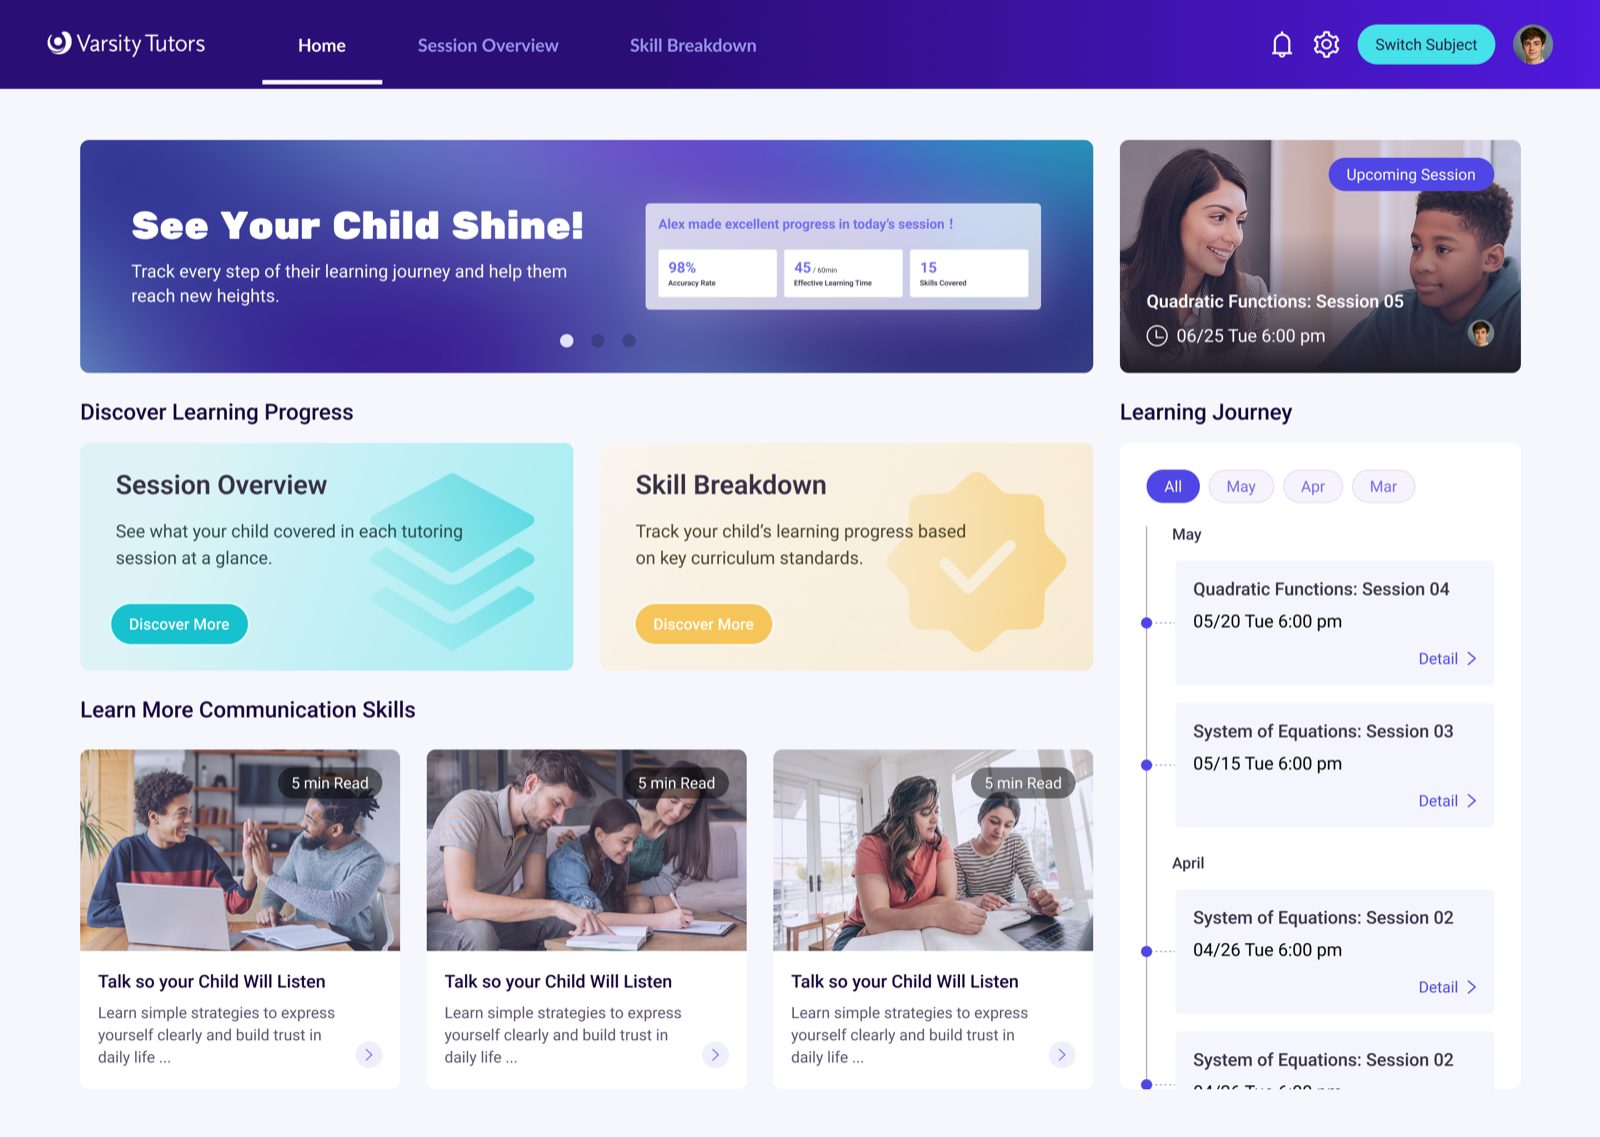
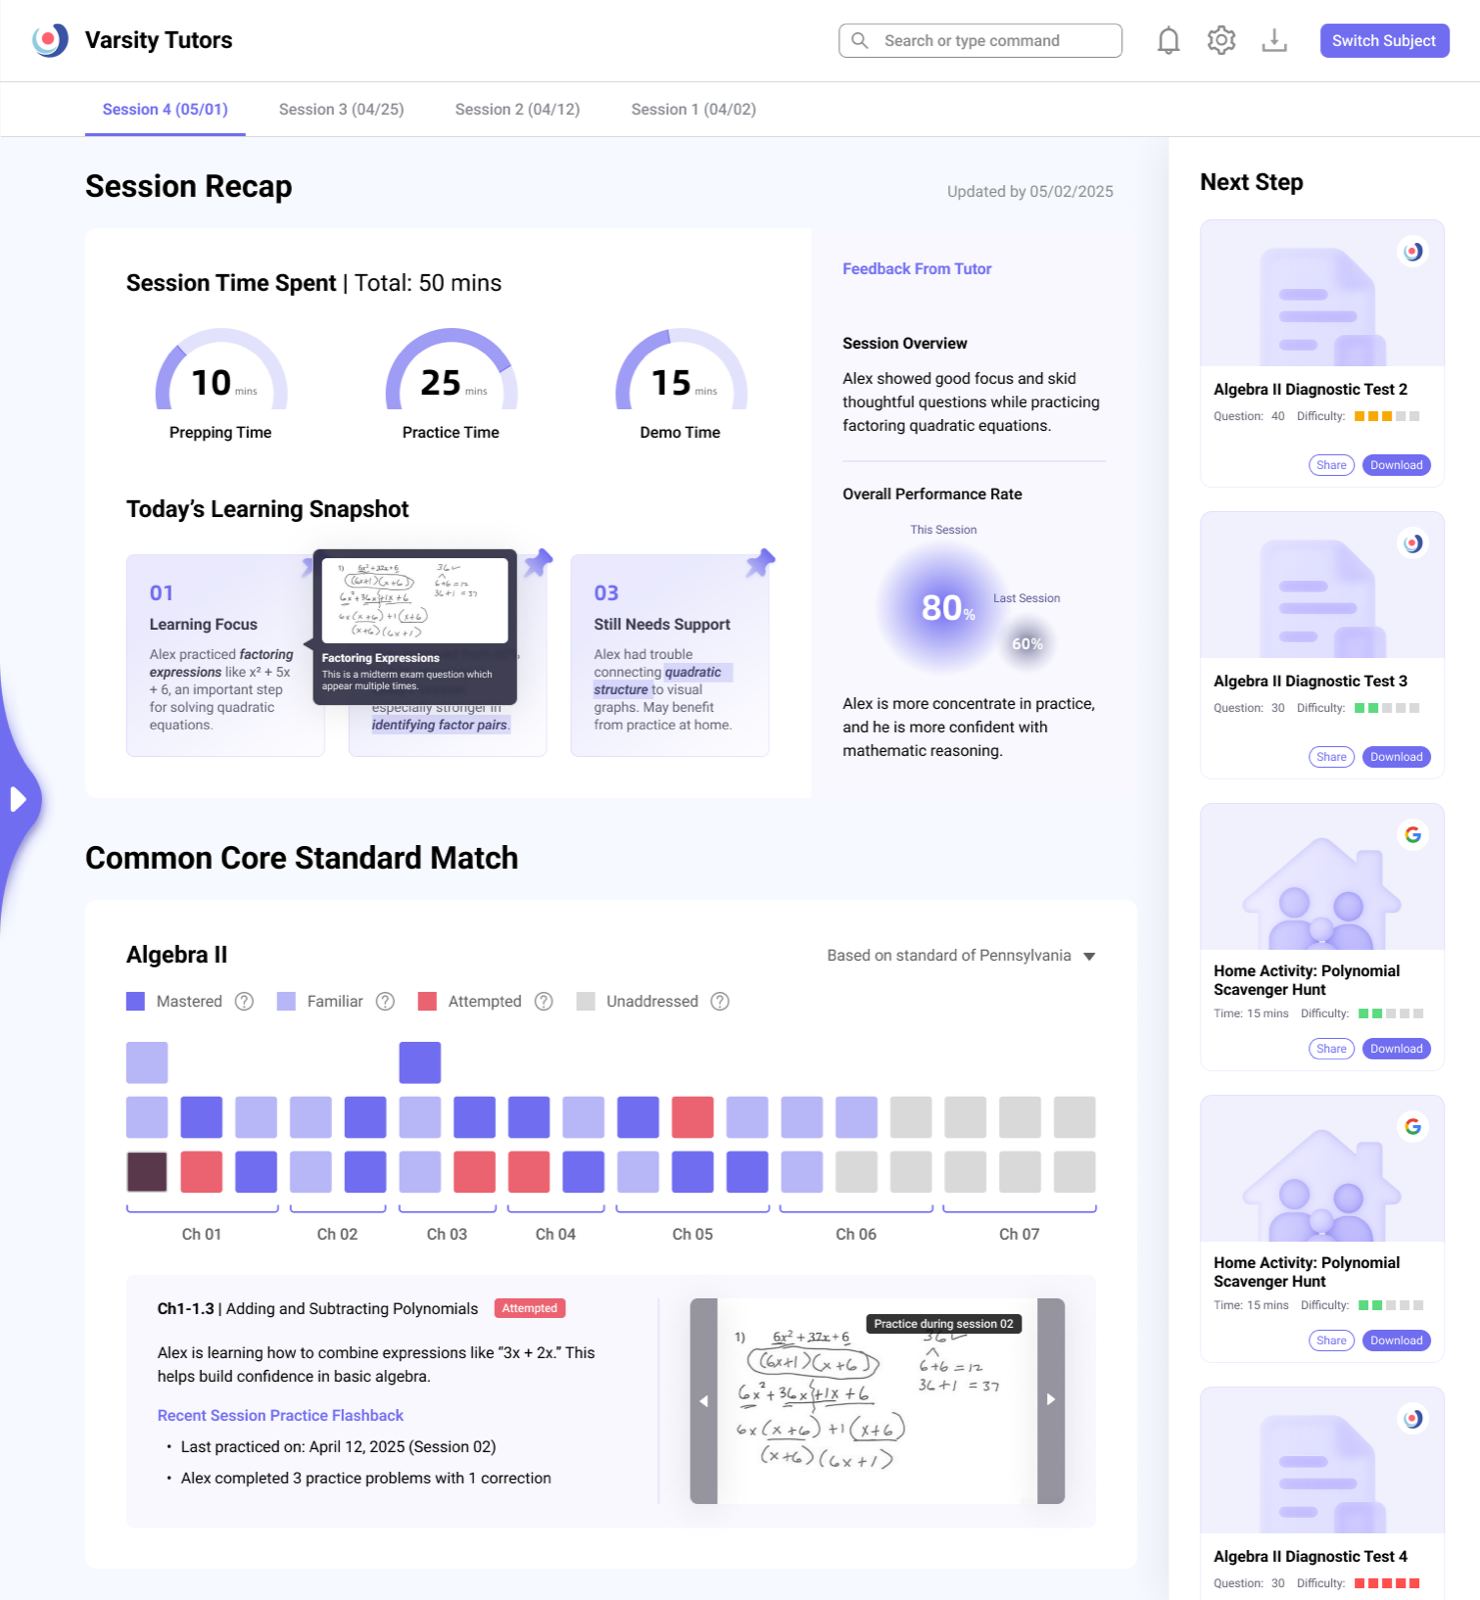
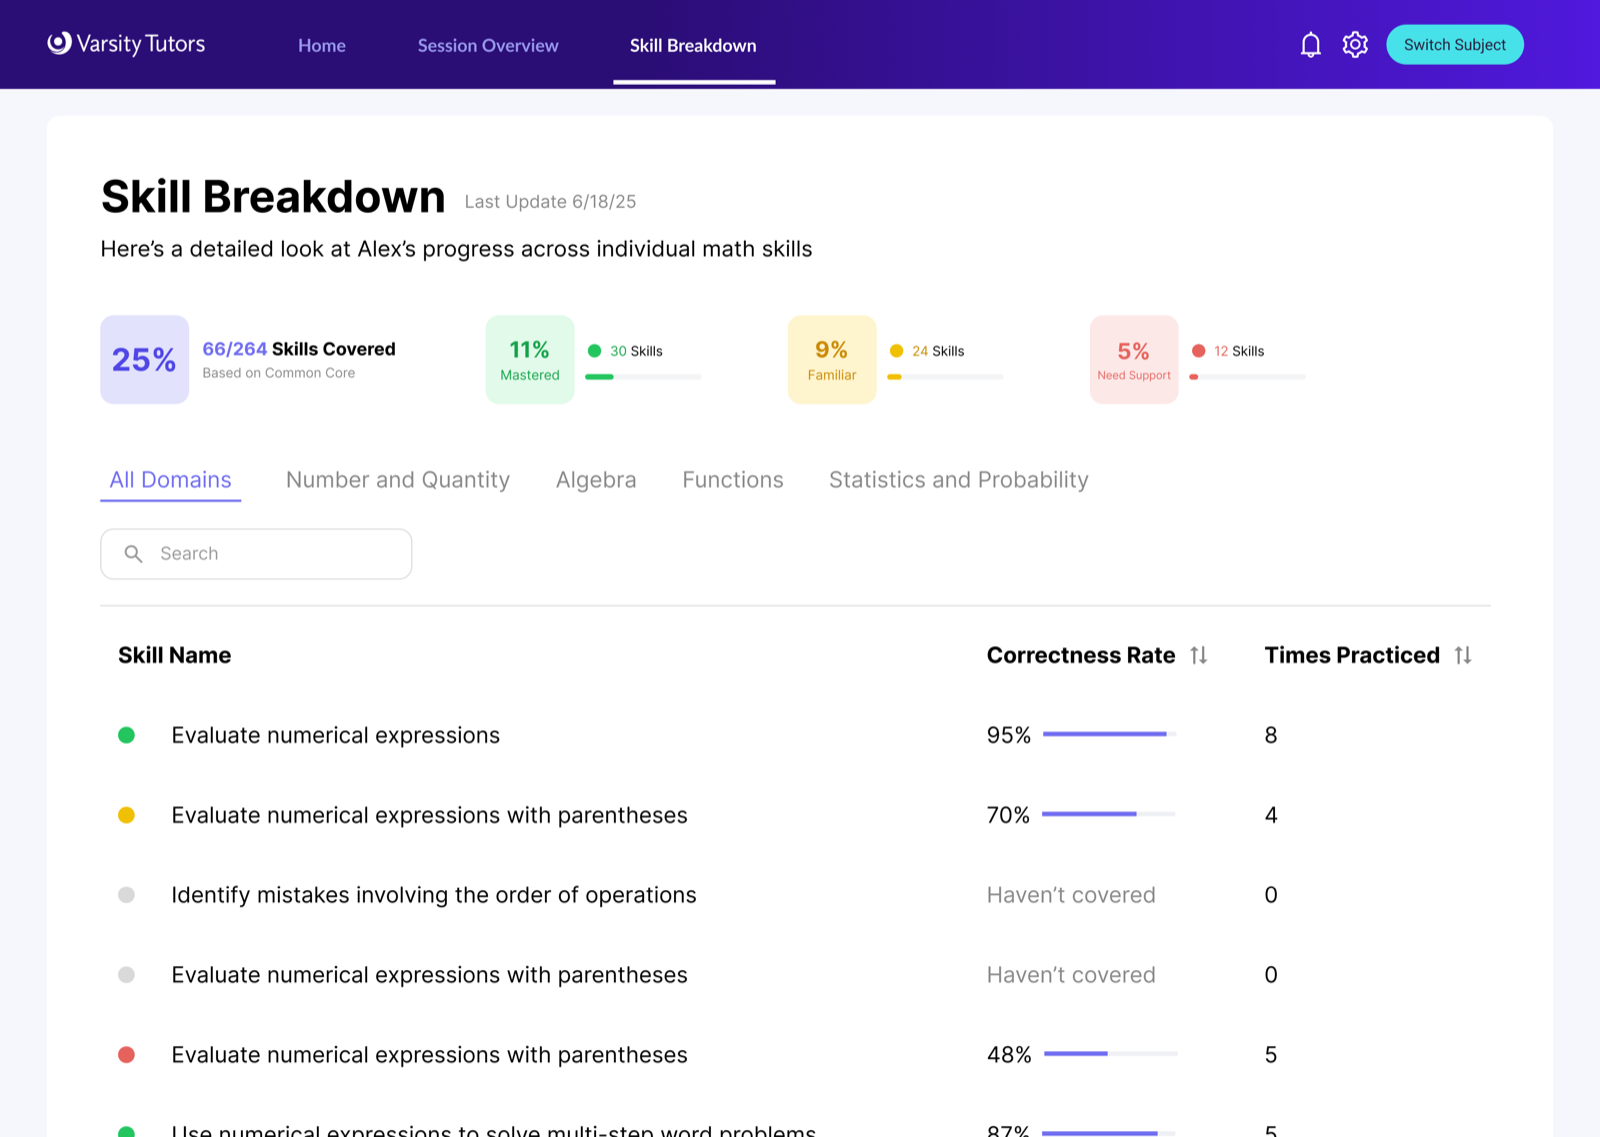
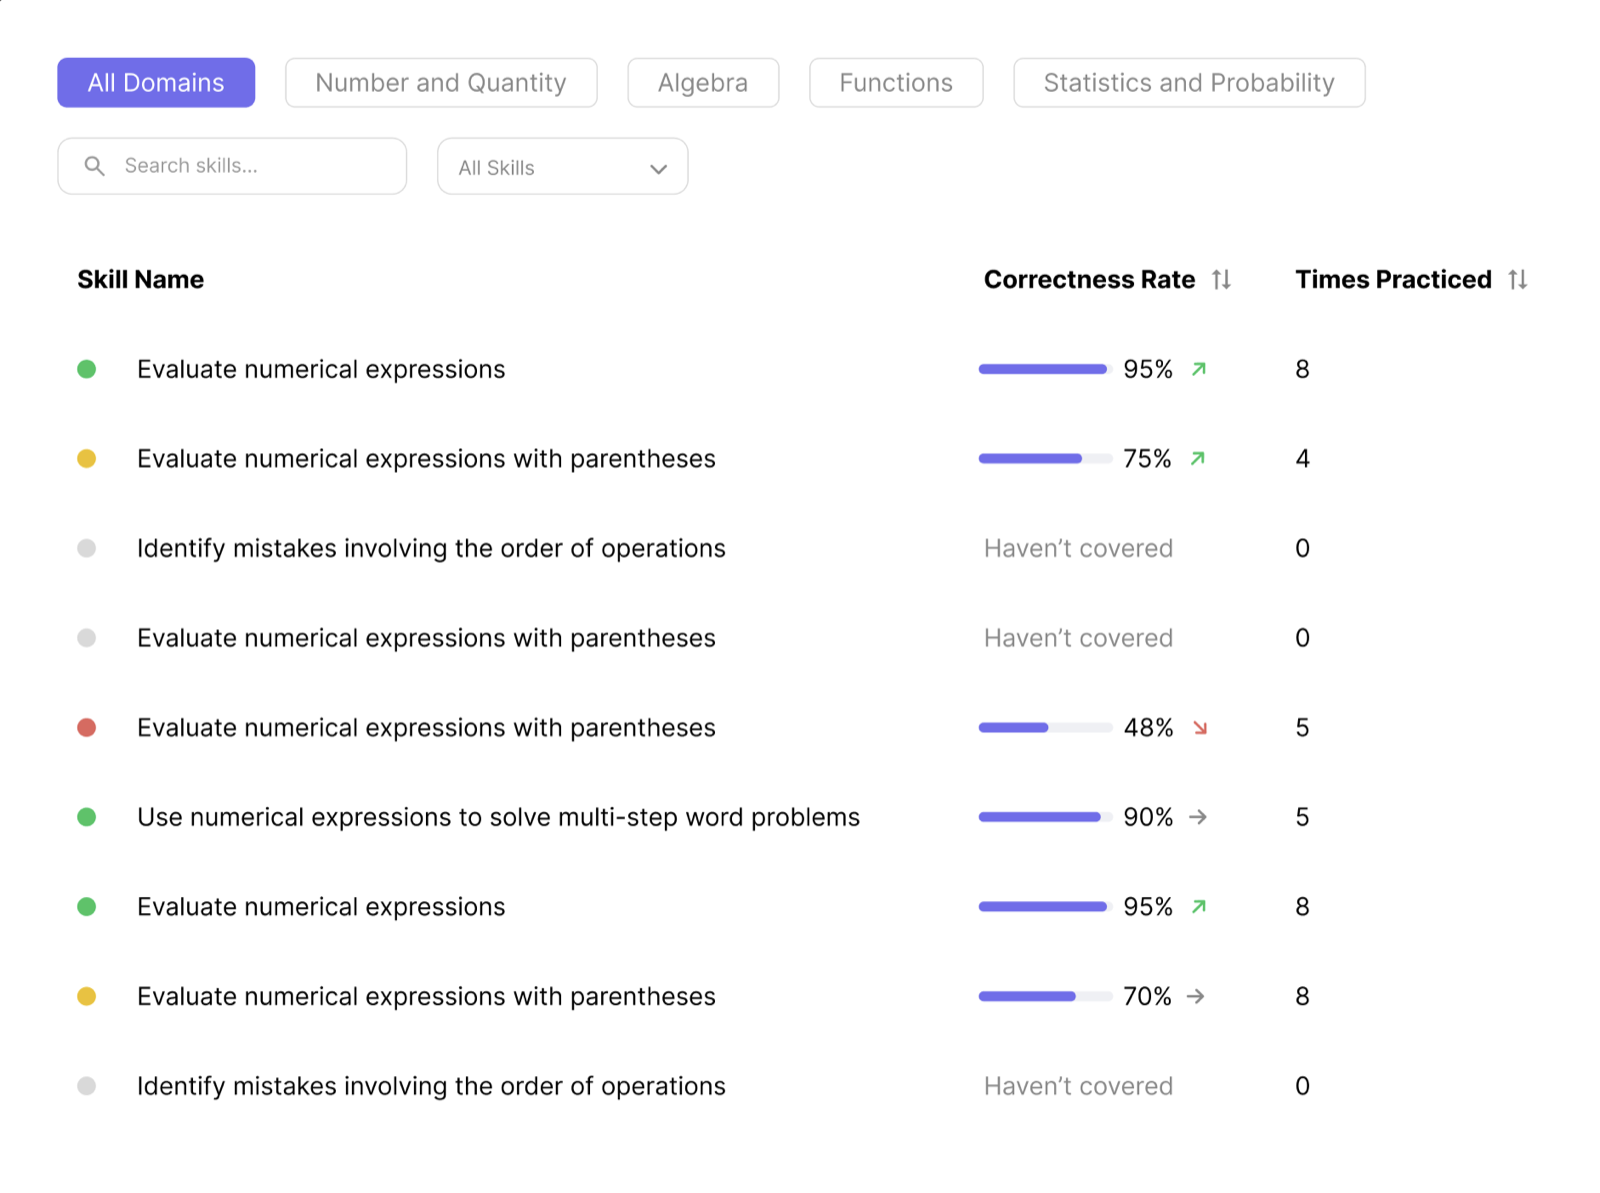
← Swipe to browse →
Final MVP · 01
A homepage that guides, not dumps
The homepage's job is to guide, not to show everything at once. A personalized opening message, clear entry points to the session view and overall progress, and quick access to history and schedule. Earlier versions packed in more data — and just raised cognitive load.
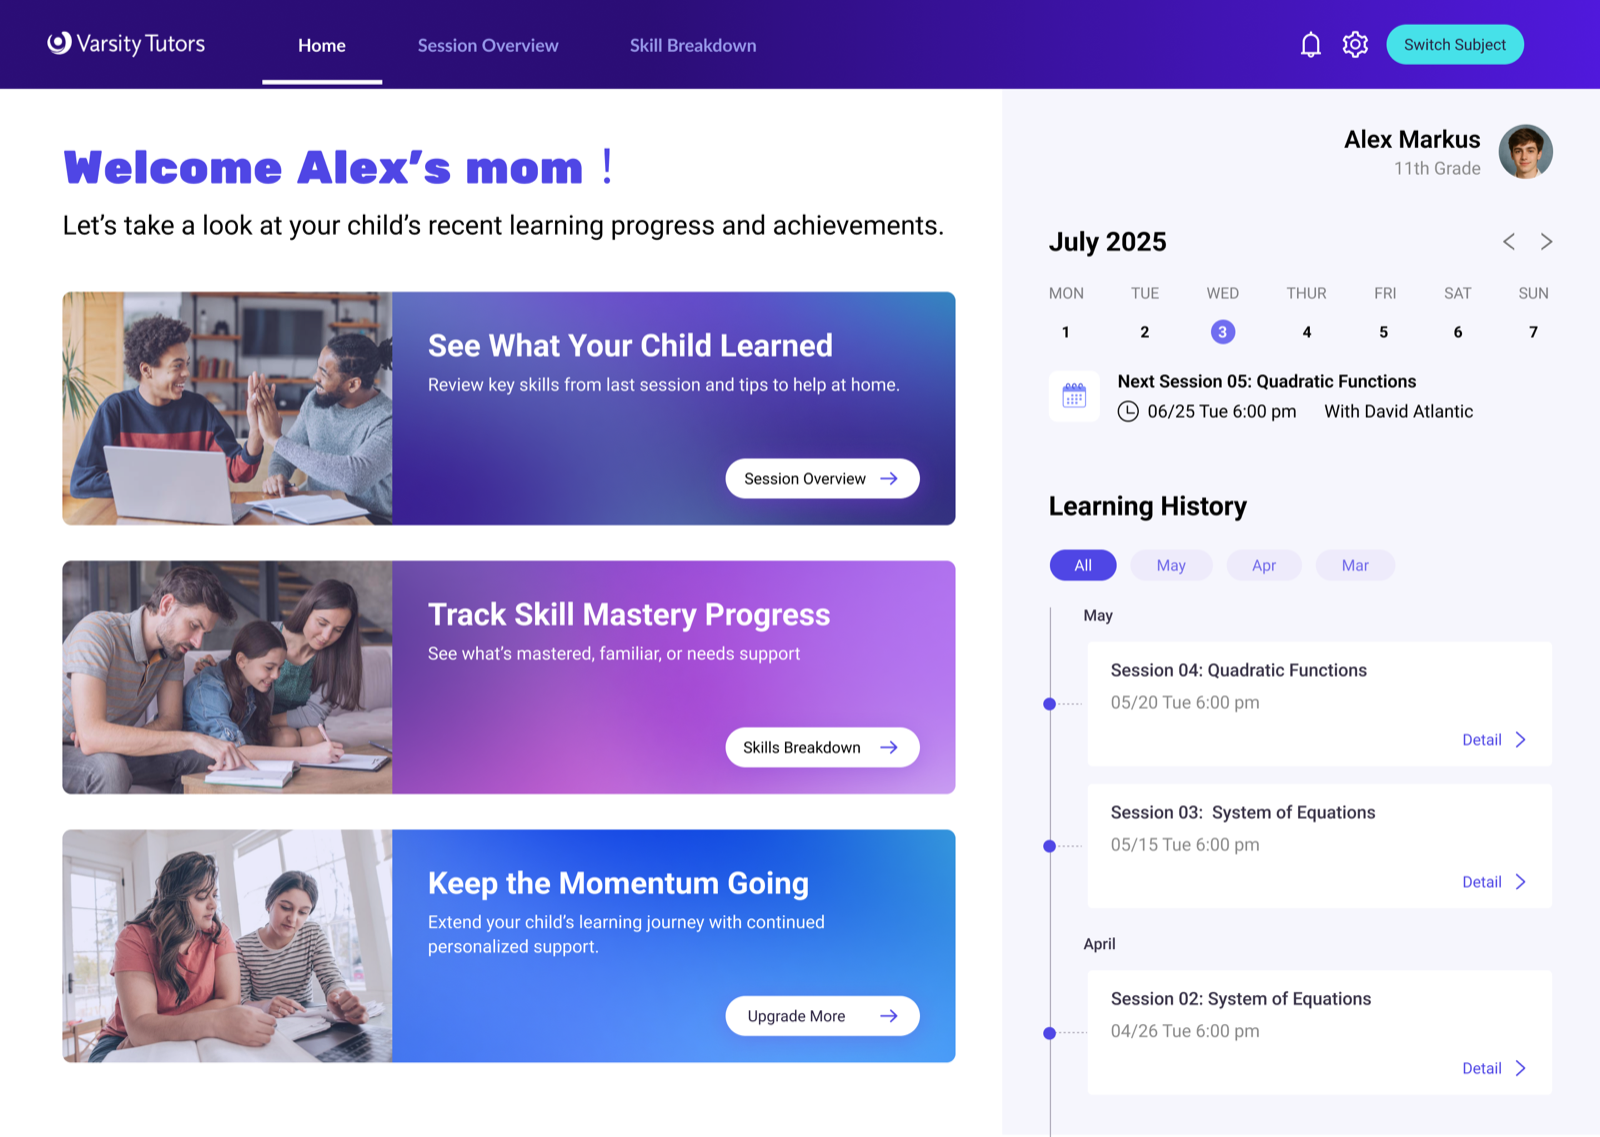
Opening message
A personalized greeting for quick understanding.
Individual session progress
The latest session's recap and suggested plans.
Overall subject progress
Subject-level mastery, and where help is needed.
Service support entry
Easy access to follow-up services.
Schedule reminder
Keeps parents aware of upcoming sessions.
Learning history
Quickly locate past learning sessions.
Final MVP · 02
Understand a session in 30 seconds
The goal: let a parent understand how a session went in about 30 seconds. Three high-level metrics summarize performance, with hover explanations that clarify the data logic without interrupting the read. Below, skill highlights — and a cross-session view and at-home cards that came straight from testing.
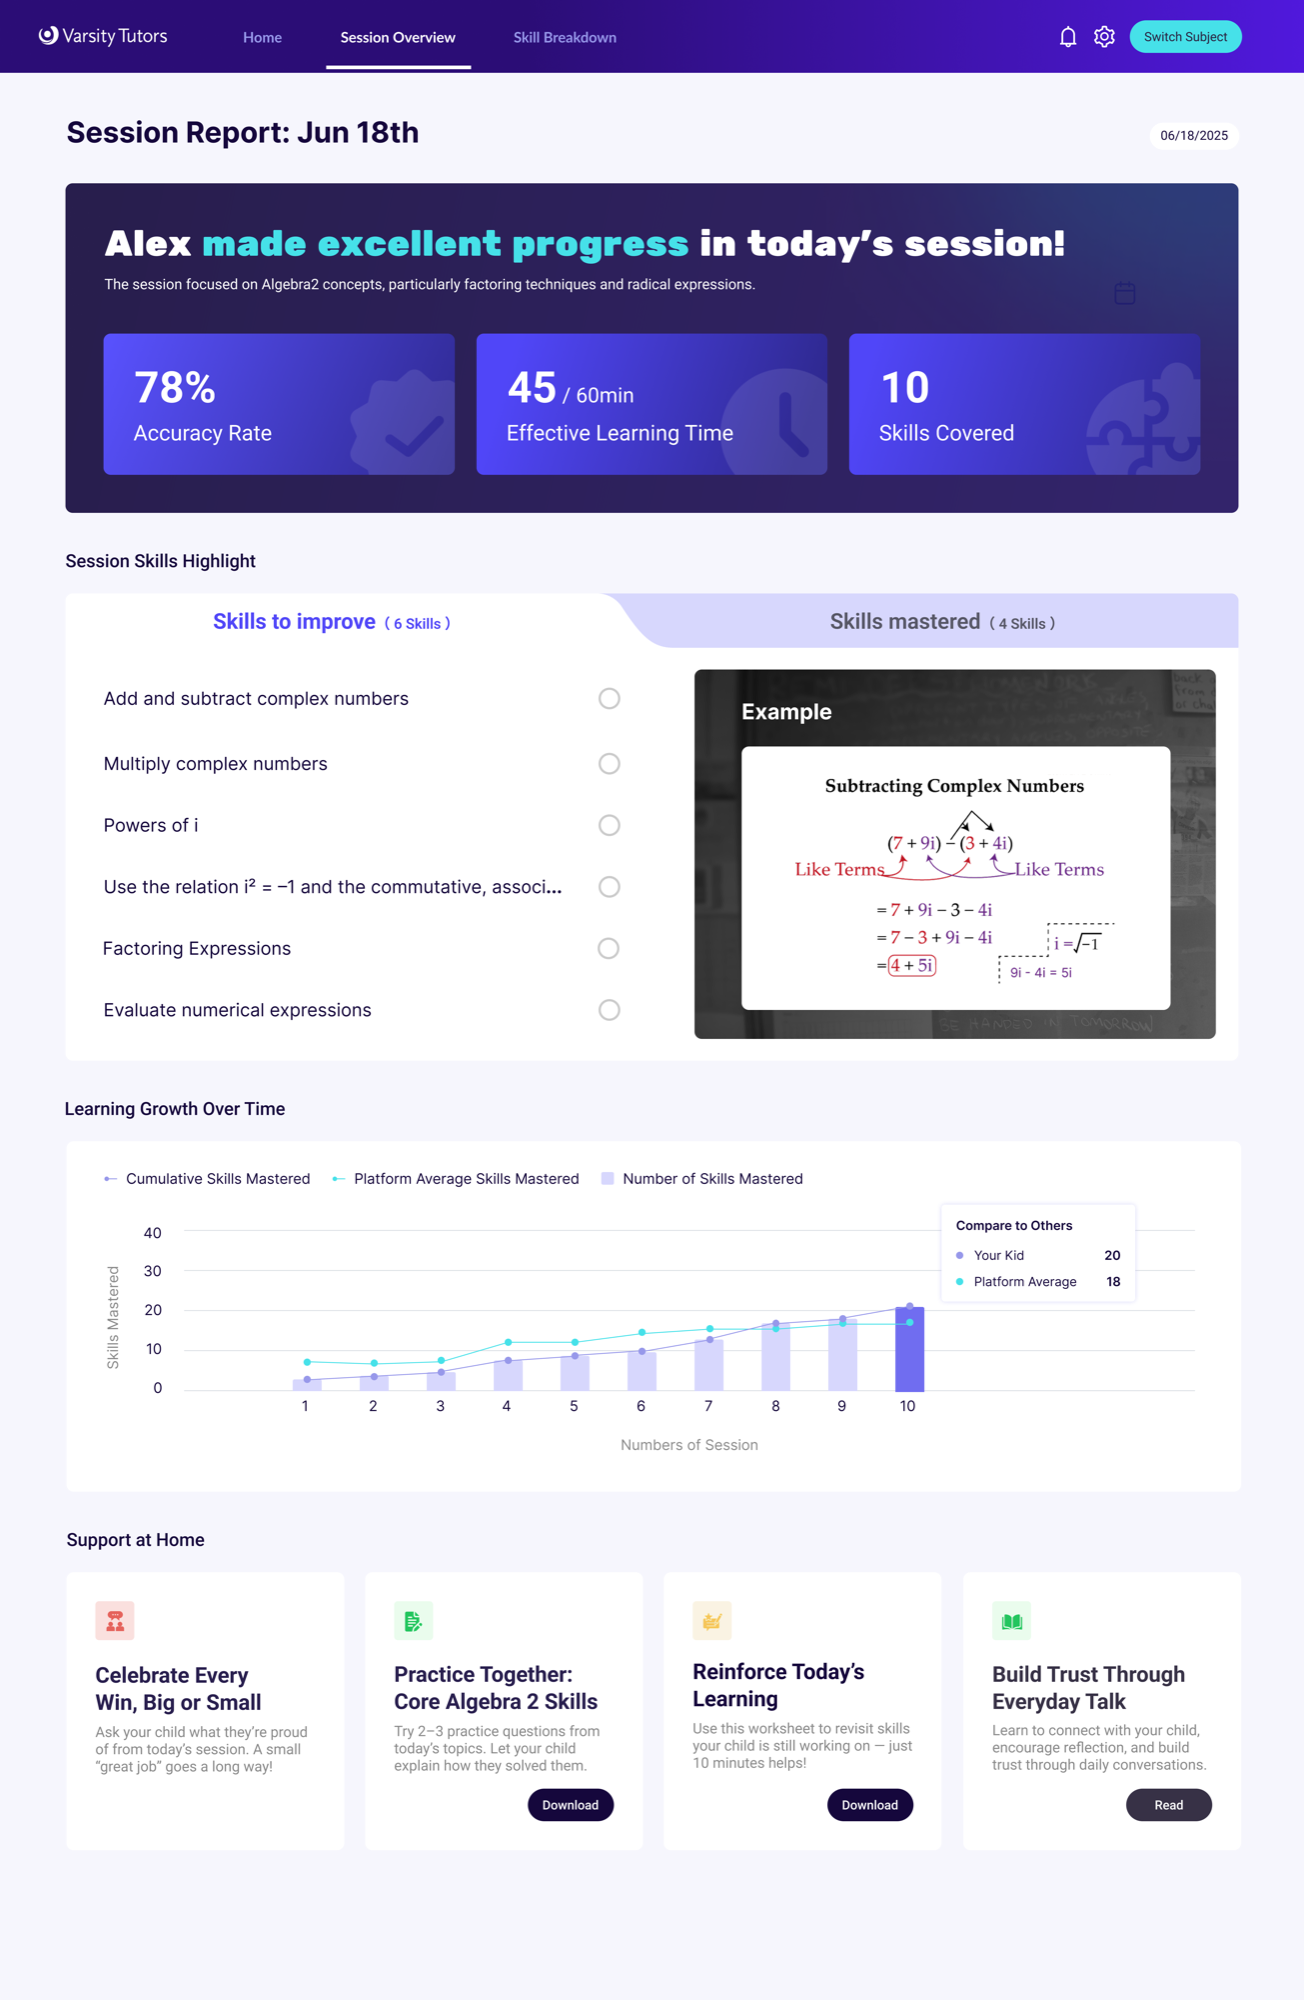
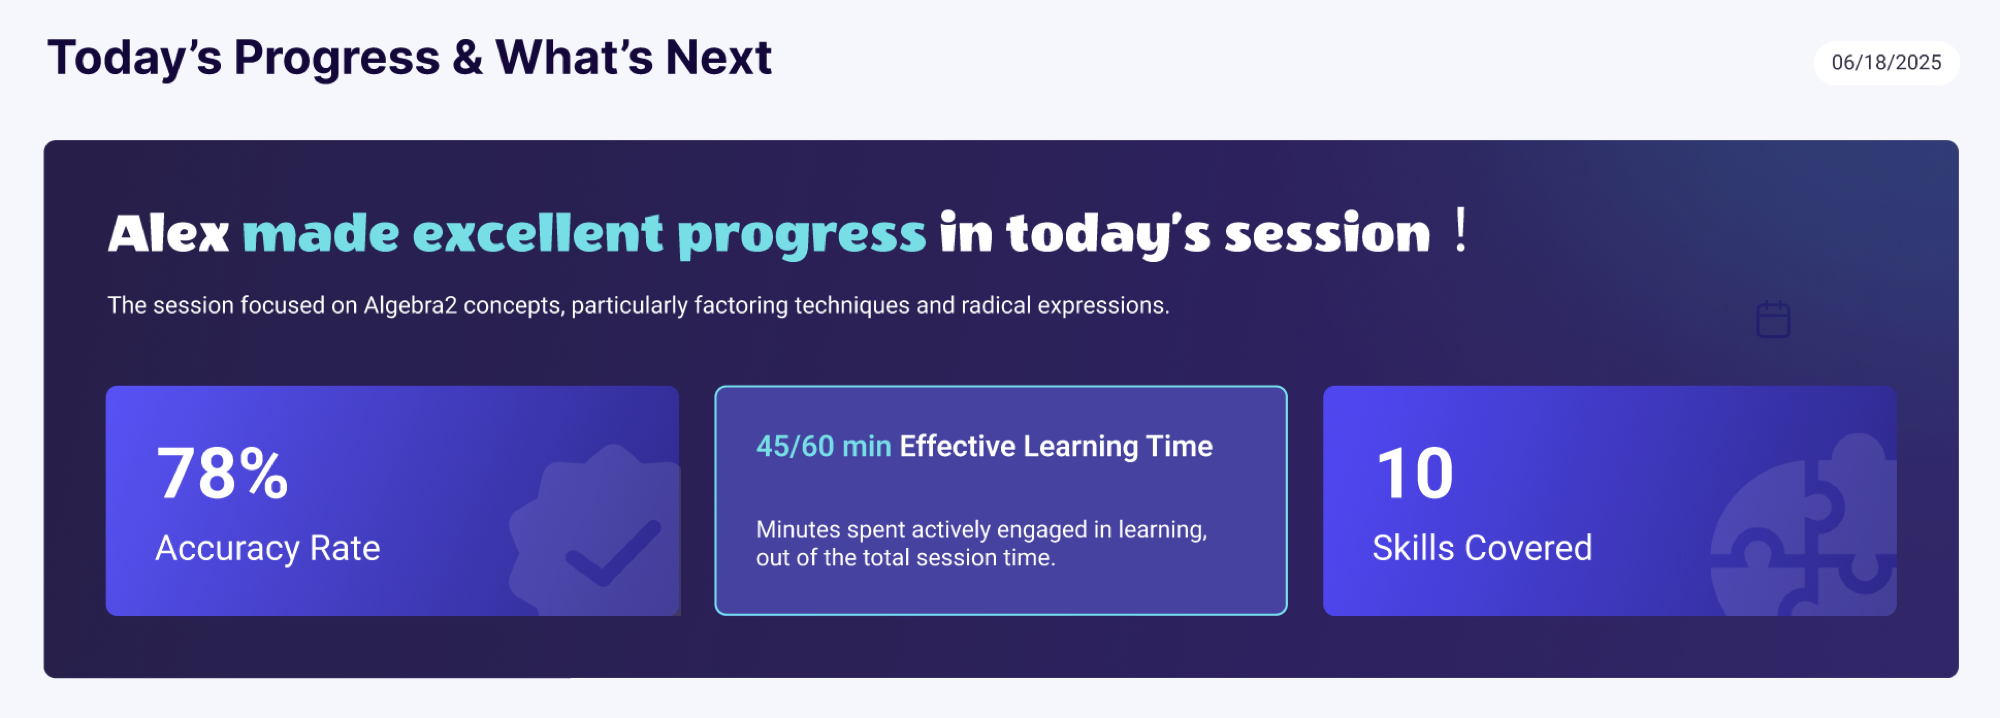
Quickly tell parents what happened this session
- Accuracy Rate — inferred from the keywords and problem-solving phrases in the transcript.
- Effective Learning Time — the transcript stripped of opening/closing chatter, leaving the focused tutor–student exchanges.
- Skills Covered — carried into the skills view below.
Learning science · Formative Assessment
Skill-level feedback after each session lets instruction adapt to how it actually went.
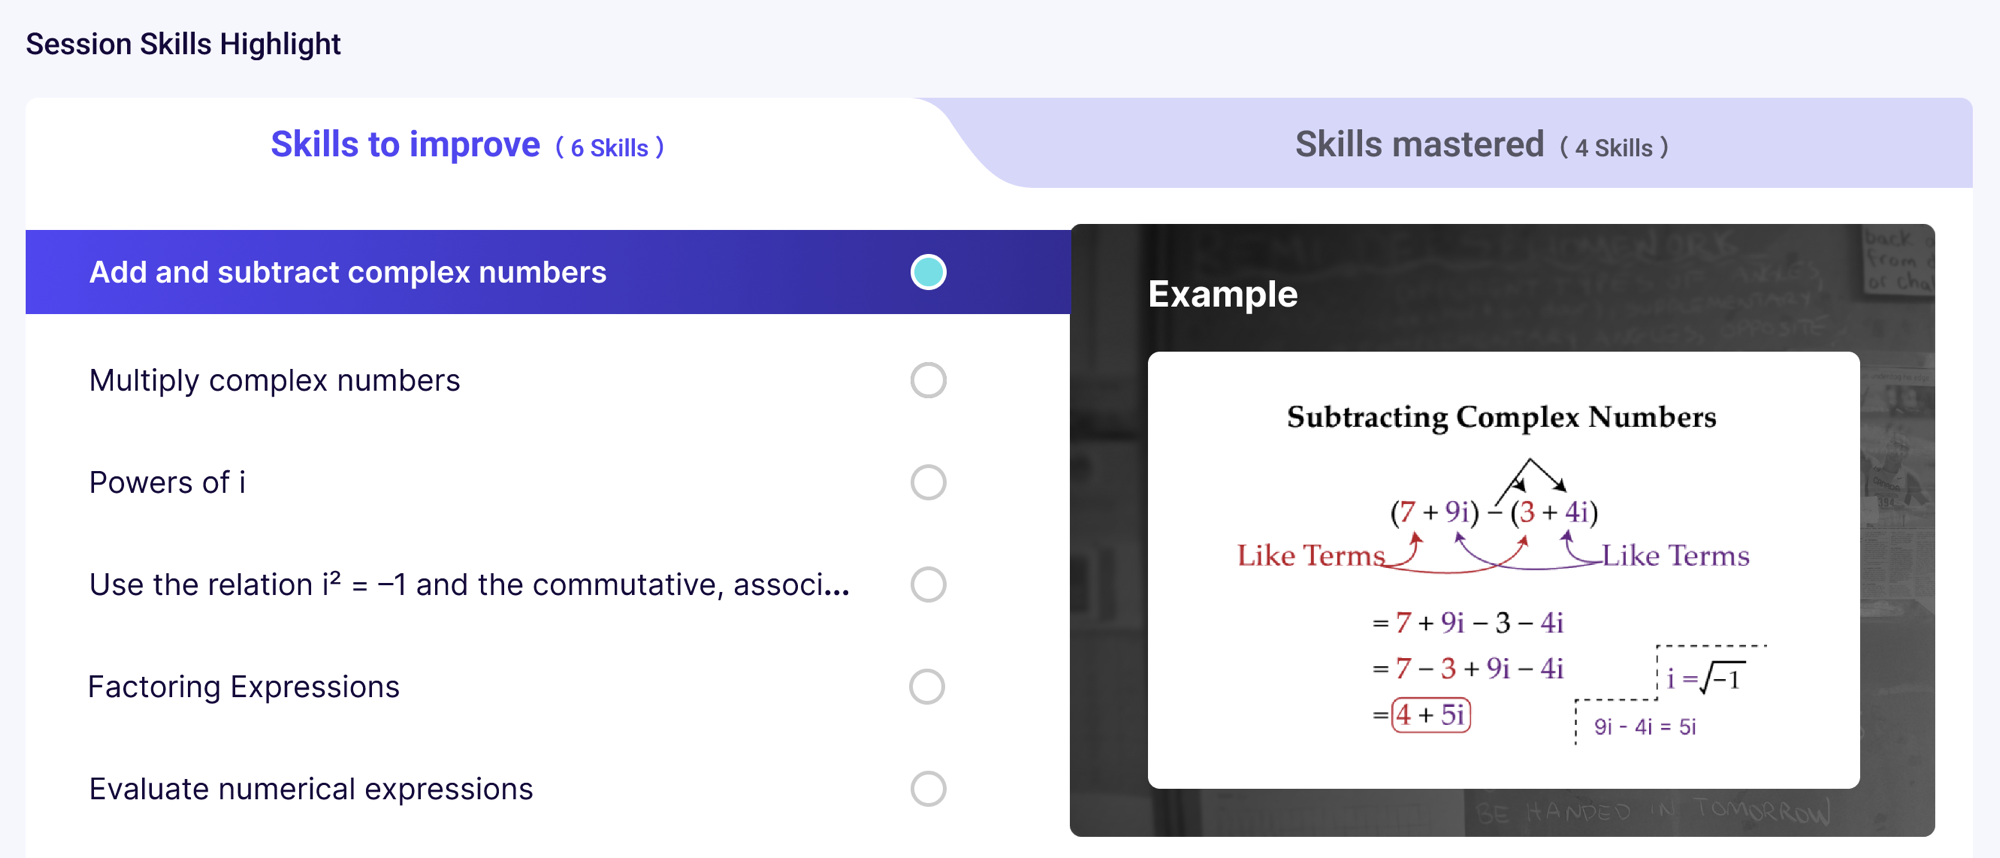
A deeper look at what was practiced and mastered
- Practiced skills matched to Knowledge Components (KCs) via subject-specific keywords.
- Tutor–student dialogue classified as mastered, confused, or skipped.
- AI generates a matched worked example for each KC.
Learning science · Dual Channels
Text and a visual example shown together aid memory and comprehension.
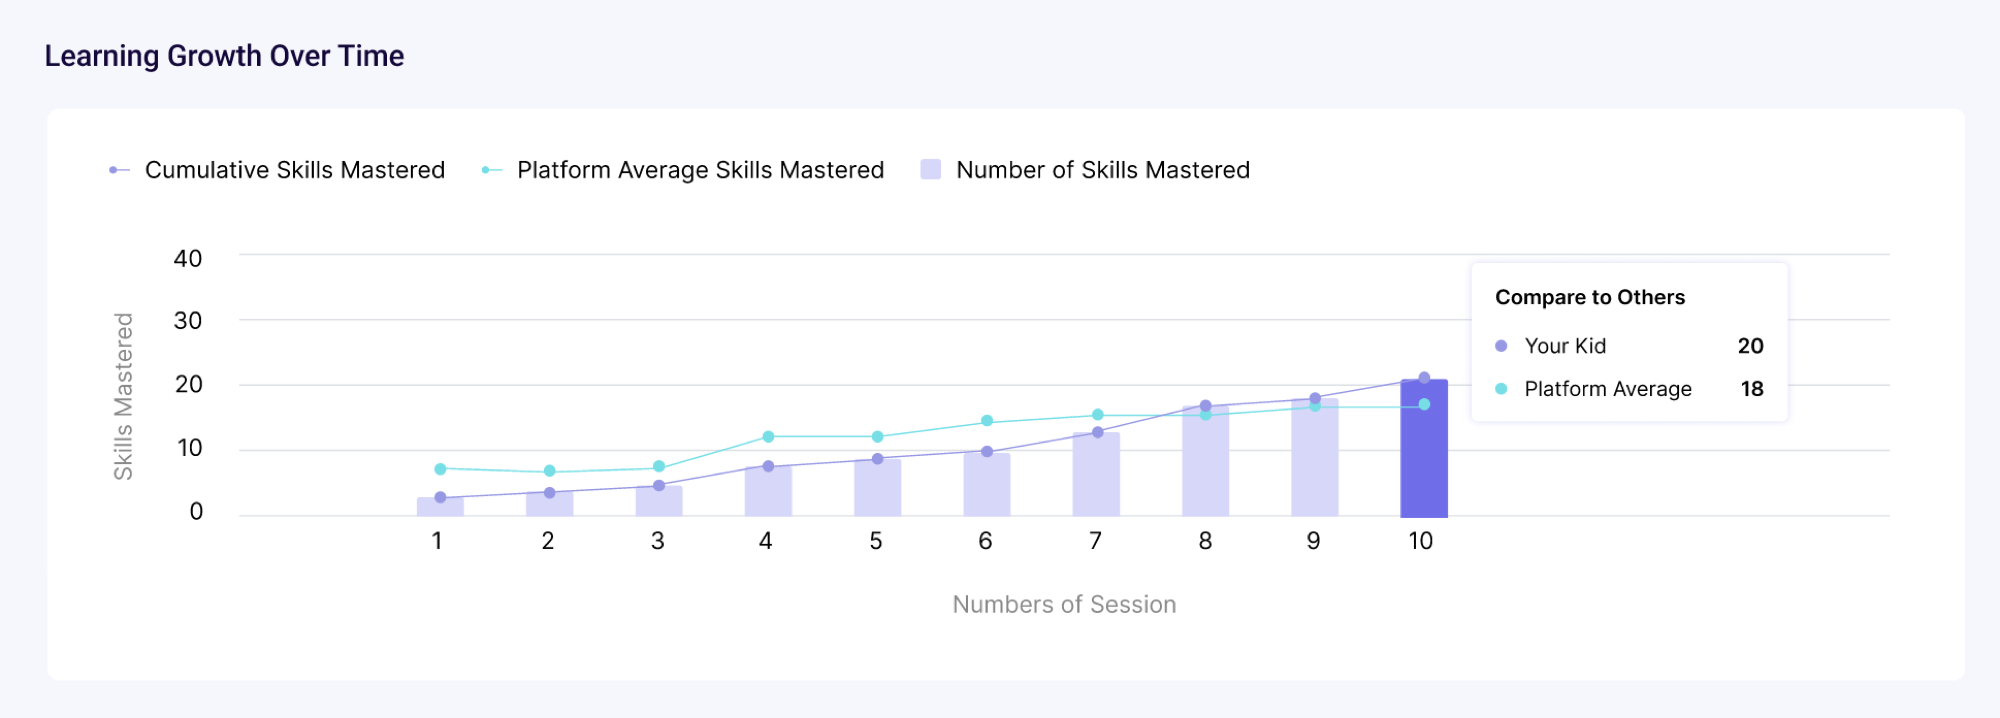
Long-term progression across sessions
- Skill-mastery data aggregated across every session.
- Compared against platform-wide averages.
- Cumulative growth surfaced for trend reading.
Learning science · Goal Setting
Seeing progress against a benchmark helps families set realistic learning goals.
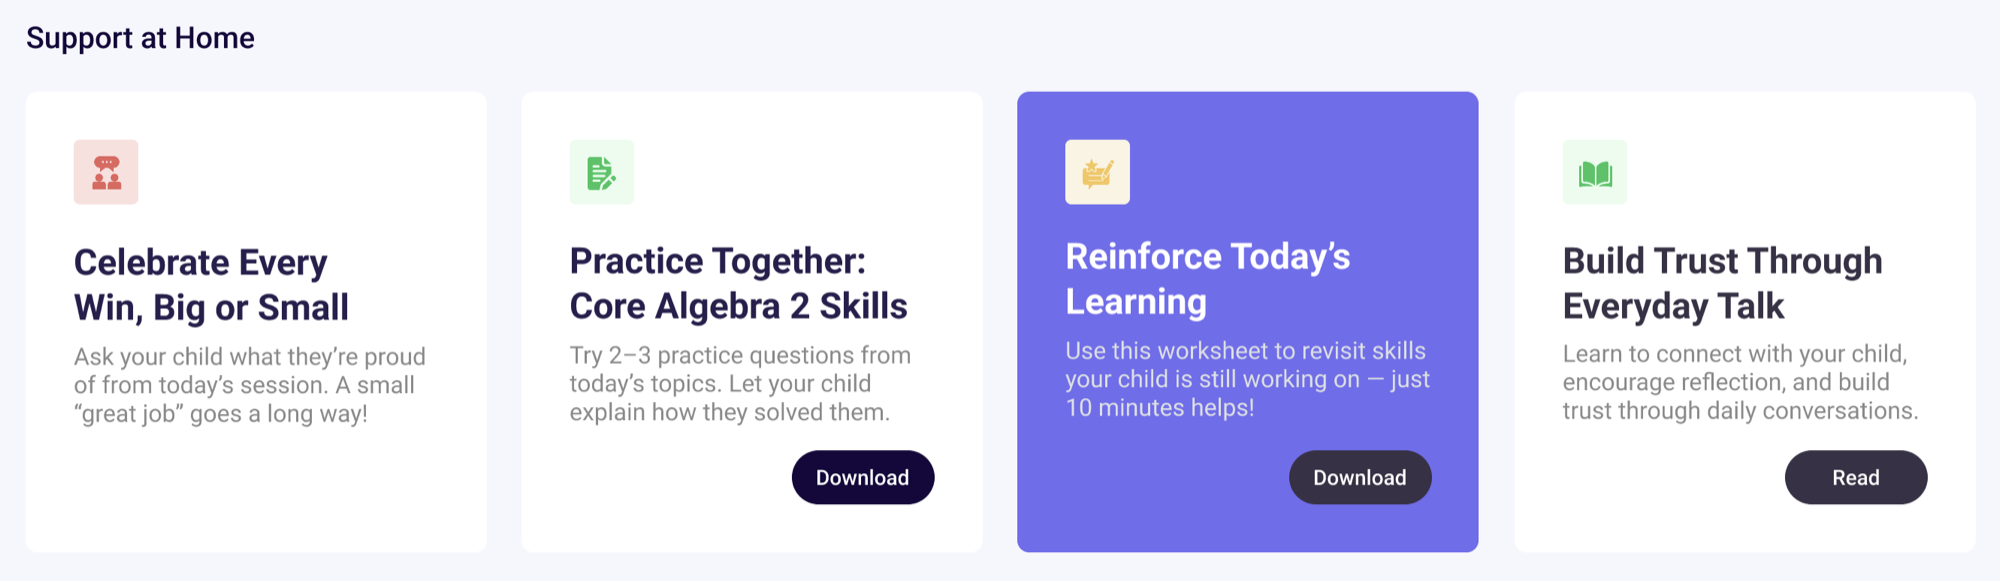
Reinforce learning at home with actionable tips
- Cards recommended from recently practiced skills.
- Messages tailored to session performance and behavior cues.
- Parents can download or open the relevant materials.
Learning science · Growth Mindset
Cards like “Celebrate Every Win” nudge positive reinforcement and continuous growth.
Final MVP · 03
Where they stand across the subject
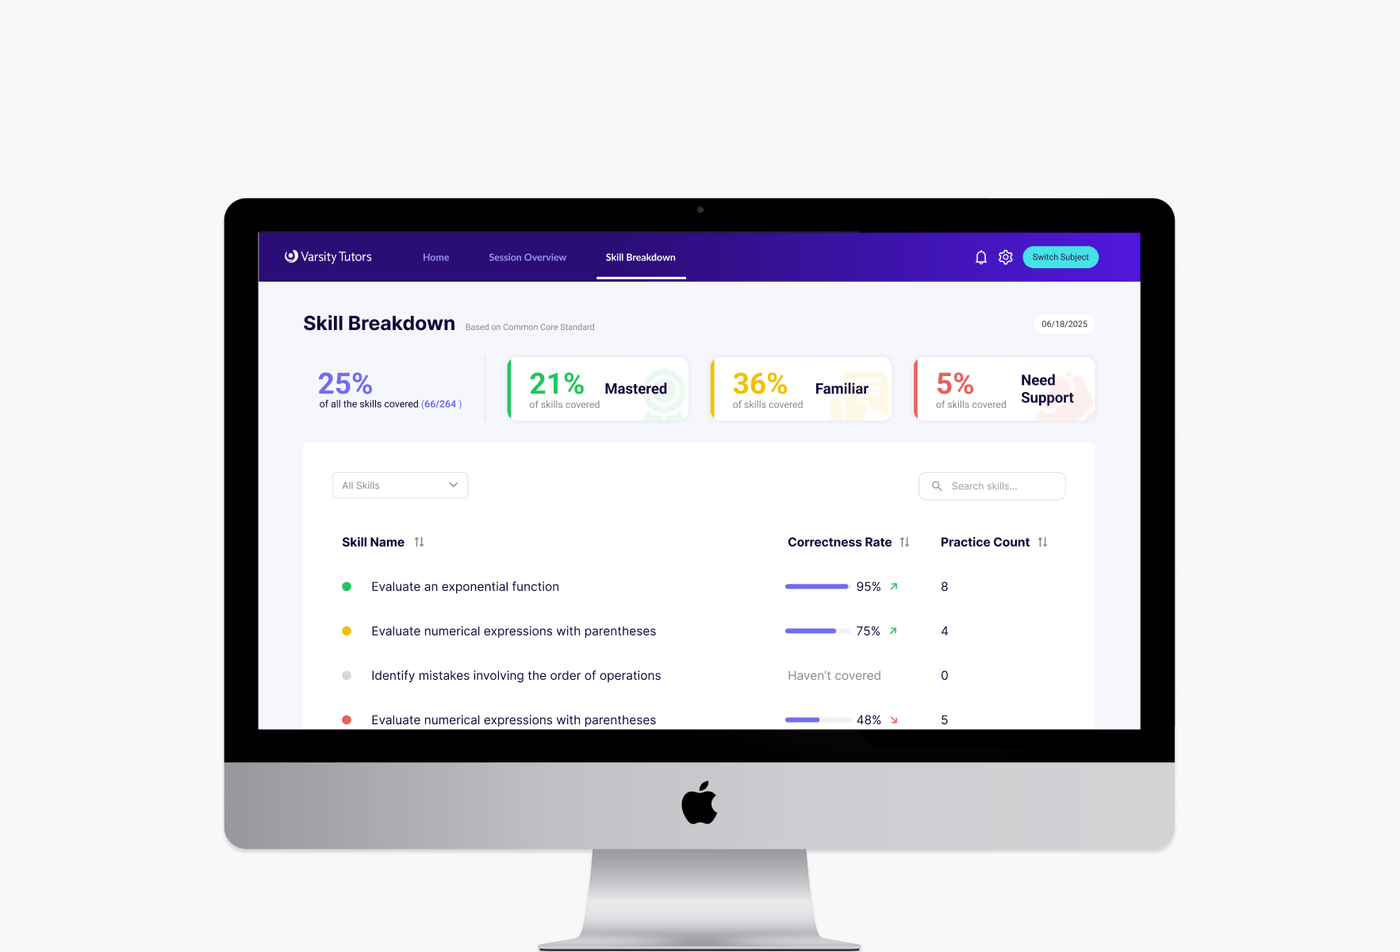
If Session Overview answers 'what happened this session,' Skill Breakdown answers 'where does my child stand across the subject?' An AI agent breaks down each practice, scores it on accuracy and repetition, and sorts skills into levels parents can read.
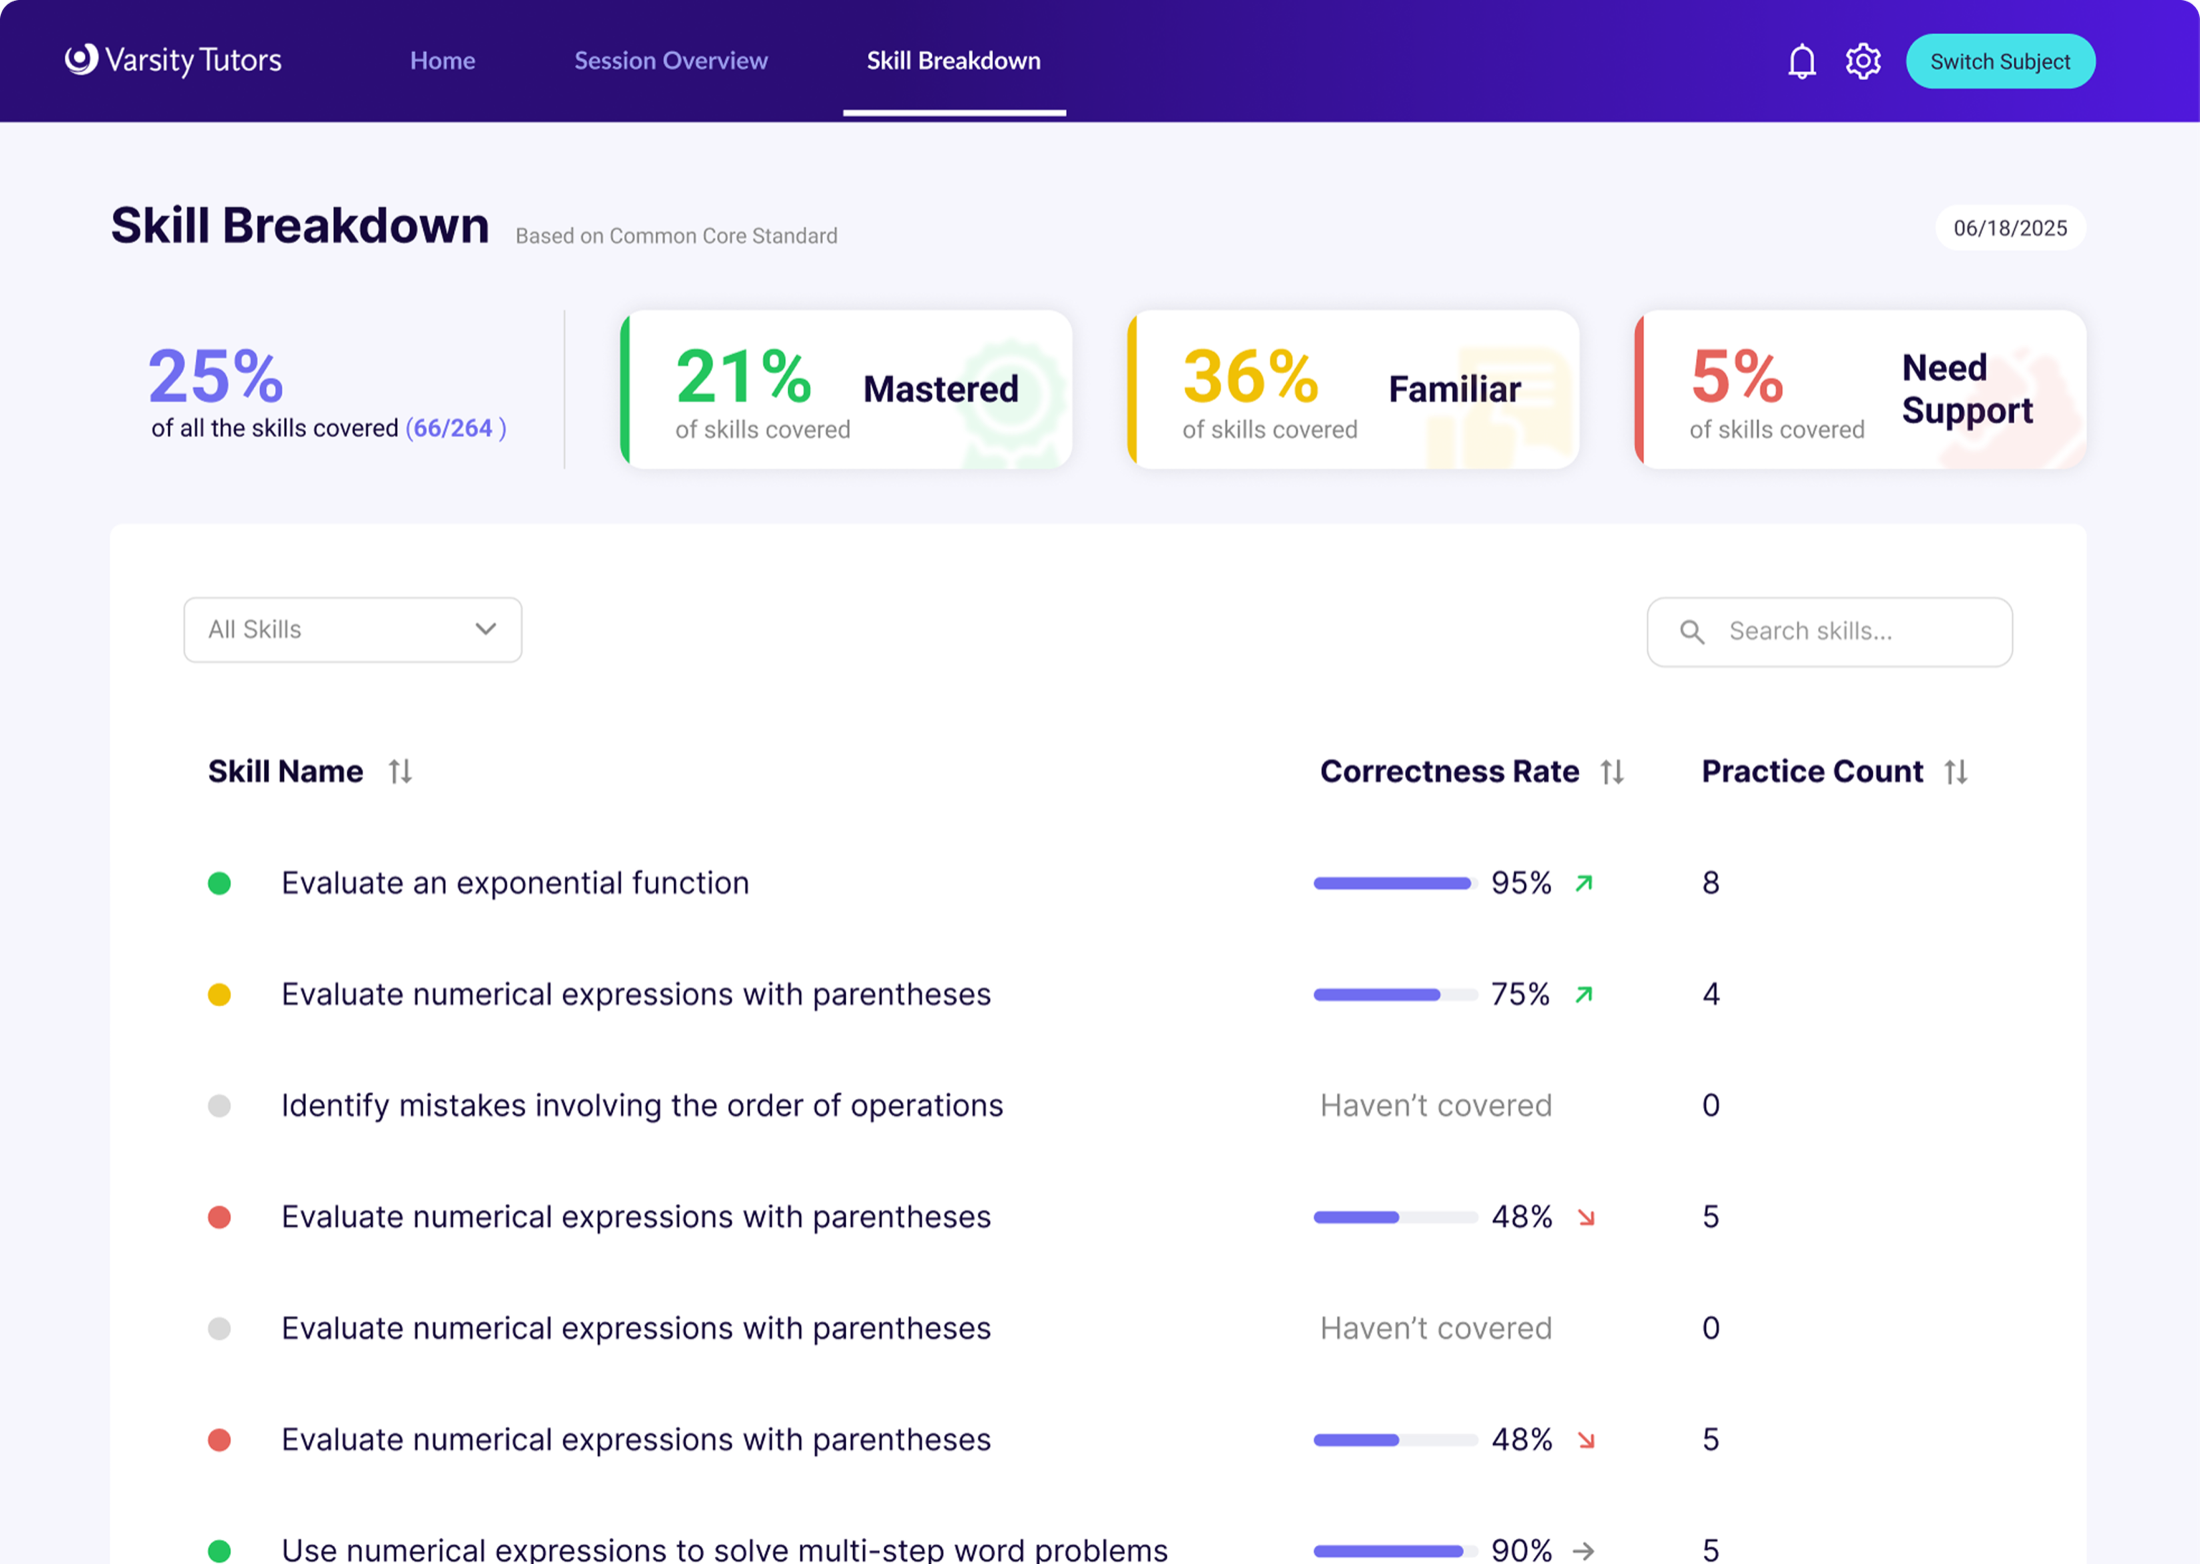

Reveal how mastery levels are calculated
- An AI agent breaks down each practice segment — extracting the question, reading the student's thinking, weighing the tutor's feedback, and marking the attempt correct or incorrect.
- Mastered — practiced 3+ times at ≥90% accuracy.
- Familiar — accuracy between 70–89%.
- Need Support — accuracy below 70%.
Learning science · Interpretable Levels
Plain, named levels beat an opaque continuous score parents can't act on.
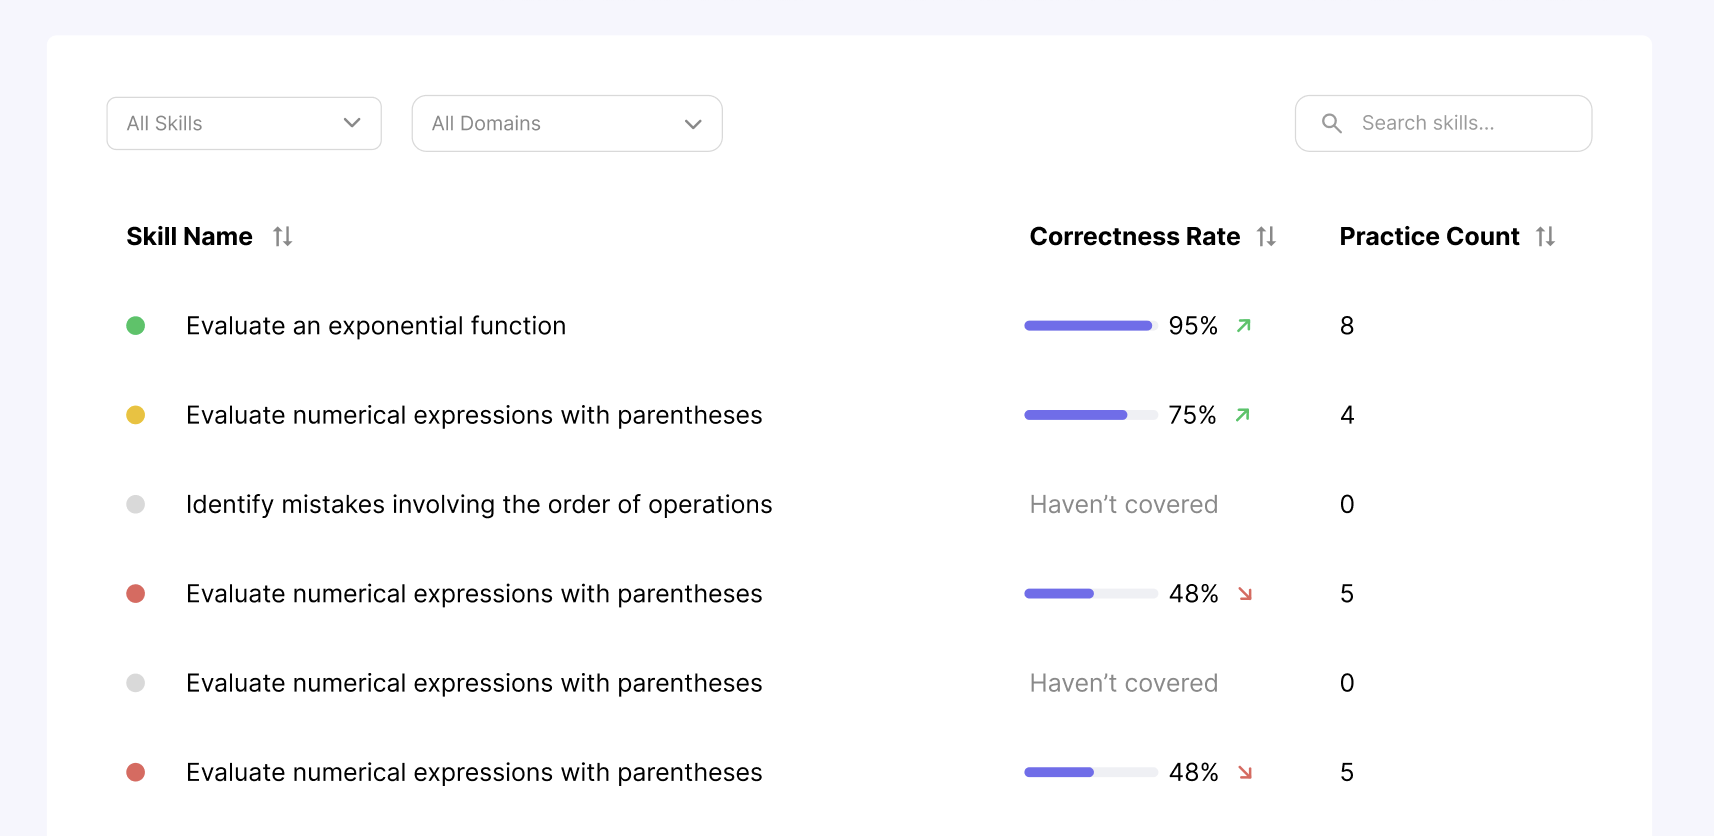
Help parents focus on the skills that matter
- Filter the list by mastery level or domain to zoom straight to the relevant subset.
- Each row carries the evidence — skill, correctness rate, and practice count.
- A simple mastery filter looked minor but was used constantly in testing.
Learning science · Evidence per Skill
Every label is backed by the numbers behind it, so parents can trust the read.
Outcome & next steps
From more data to the right data.
Testing validated the shift from more data to the right data — structured around the questions parents ask, and guided toward action. The MVP (homepage, session reports, and skill breakdown) is now in Varsity Tutors' development pipeline. Given more time, the next steps are: a human-in-the-loop to validate and improve AI accuracy; expanding beyond Algebra to more subjects; and larger-scale testing with real Varsity users to measure long-term value.
Takeaways
What this taught me.
Design trust and visibility, not just features
As systems get smarter, the job shifts: people won't hand control to something they can't see or understand. Most of this project was making an AI's reasoning legible enough to trust.
Structure beats more data
Parents didn't need more numbers — they needed the right ones, organized around the questions they already ask. The same data, restructured, went from confusing to actionable.
Sometimes the best feature is the one you cut
Removing the unreliable emotion self-report protected the trust the whole product depended on. Useful isn't the same as feel-good.